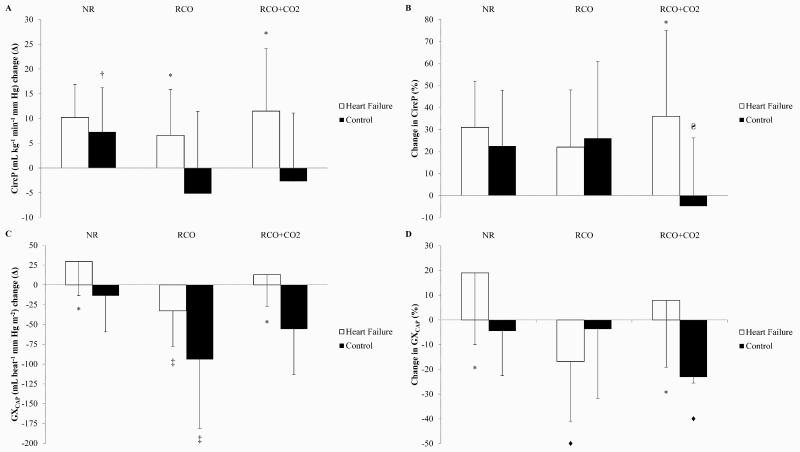
Figure 2.
Differences in circulatory power (CircP) or pulmonary vascular capacitance (GXCAP) between baseline and 2 min post-exercise. Data presented as means±SD. (A) CircP, absolute change (Δ). (B) CircP, percentage (%) change. (C) GXCAP, absolute Δ. (D) GXCAP, % change. †NR vs RCO in controls, (P<0.05); ΔDifferent between RCO and RCO+CO2 in controls, (P<0.05); ‡Different between NR and RCO in heart failure and controls, (P<0.05); ♦Different between NR and RCO in heart failure, and RCO+CO2 vs NR or RCO in controls, (P<0.05); *Heart failure vs. controls (P<0.05).

