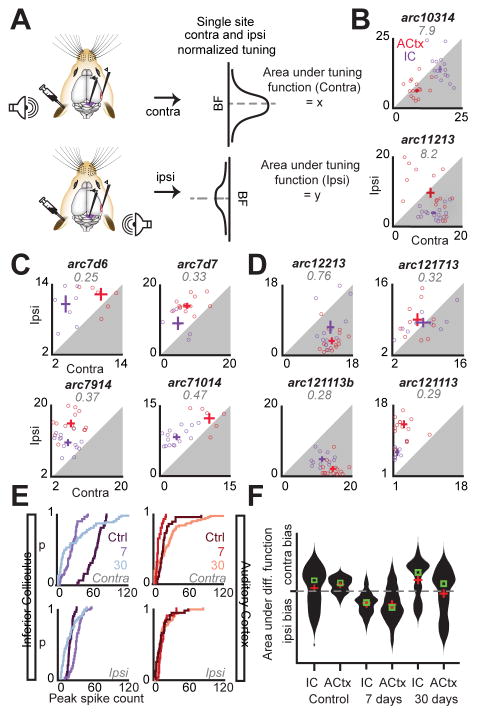
Figure 7. Dynamic switches in representational dominance between the denervated and intact ears.
(a) Unilaterally ouabain-treated animals were fitted with an earplug in either the control or treated ear as sound stimuli were presented to the unplugged ear. Recordings were performed in the IC and ACtx, contralateral to the treated ear, and ipsilateral to the control ear. Stimuli were pure tones from 4–64 kHz in frequency and 0–70 dB in level. Normalized frequency response functions at best level were calculated at significantly responsive (through either ear) recording sites for the ipsilateral (intact ear) and contralateral (ouabain-treated ear) stimulation conditions. The integral of each tuning function was calculated using a trapezoidal approximation, and plotted for each site with Contra on the x axis and Ipsi on the y axis. (b) Ipsi vs Contra tuning function area from the IC and ACtx of two control animals (animal ID indicated in black text, gray italic text indicates the average number of synapses per IHC as revealed by cochlear histopathology). Frequency response functions tend to have a contralateral bias, as evidenced by the mean for each brain area lying below the diagonal. Bi-directional error bars (thick lines) reflect standard error of the mean. (c) Data from 4 animals recorded 7 days after ouabain treatment. Having lost a significant amount of input from the normally dominant contralateral ear, multiunit sites show a bias toward the intact, ipsilateral ear, particularly in IC recordings. (d) Data from 4 animals tested at 30 days after ouabain treatment. Ipsilateral dominance persists in two mice (arc121113 and arc121713) while other mice have reverted to contralateral bias (arc12213 and 121113b). (e) Cumulative probability distribution of peak spike counts from contralateral (top row) and ipsilateral (bottom row) recording sites in IC (left column) and ACtx (right column). Bidirectional modulation of spike rates is evidenced by the extension of spike count range to above and below control levels after 30 days. (f) Distribution plots of the area of the difference function (contra – ipsi) for control, 7 day, and 30 day post ouabain conditions. Ipsilateral tuning functions are negative. Mean and median are indicated by red crosses and green squares, respectively.

