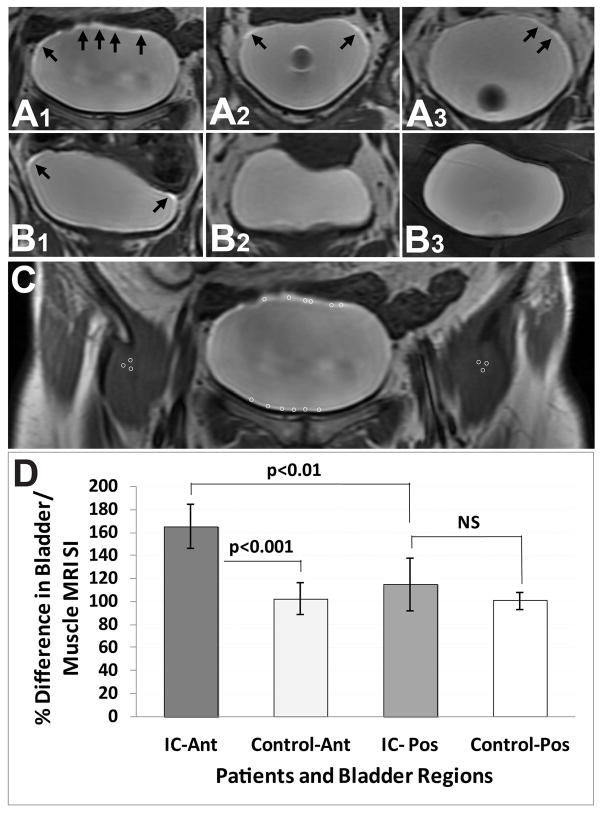
Figure 3.
Quantitative assessment of the percent difference in MRI signal intensity (SI) relative to muscle tissue in IC patients (A) and normal controls (B) 12 min post-contrast. Arrows in panels A and B depict high MRI SI post-contrast. All IC patients (A1–3) had increased SI in the bladder urothelium (dome region), in comparison to normal controls. There was one example of a normal control (B1) that had a slight increase in SI. (C) Regions-of-interest (ROIs) depicted in bladder urothelium (anterior (Ant) and posterior (Pos) regions) and thigh muscle regions. (D) Quantitative assessment of the percent difference in bladder MRI SI relative to muscle tissues in IC patients and normal controls. There was a significant increase in SI for IC patients compared to normal controls in the anterior region (p<0.0001), and a significant increase in SI in the anterior region compared to the posterior region in IC patients (p<0.01). Data represented as mean ± S.D.

