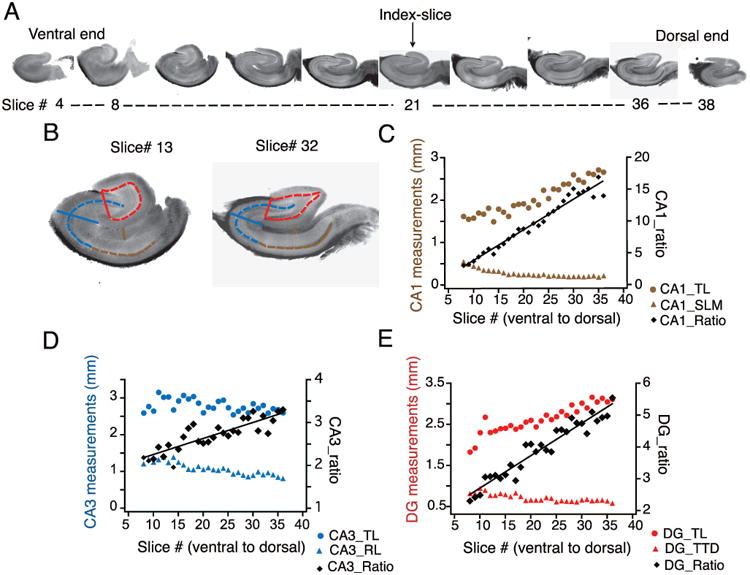
Figure 1. Measurement and quantification of the anatomical predictors of slice position in the longitudinal axis.

A) Representative images of hippocampal slices obtained from sectioning an entire hippocampus from the ventral to dorsal (V–D) end. Index-slice represents the slice where the morphology of DG granule cell layer changed from U-Shape to V-shape. B) Scheme for measurement of anatomical markers associated with the hippocampal formation depicted using representative slices close to ventral (left, slice # 13) and dorsal end (right, slice # 32): CA1, transverse length (CA1_TL, dashed brown line) and radial length of stratum lacunosum moleculare (CA1_SLM, solid brown line); CA3, transverse length (CA3_TL, dashed blue line) and radial length (CA3_RL, solid blue line); DG, transverse length (DG_TL, dashed red line) and tip-to-tip distance (DG_TTD, solid red line). C-E) Transverse (circles) and radial (triangles) measurements from CA1 (C), CA3 (D) and DG (E) are plotted against the slice number (V–D) for one representative hippocampus. The ratios of the transverse-to-radial dimensions (black diamonds) of CA1 (C), CA3 (D), and DG (E) are plotted against the slice number. There was a significant linear correlation (tested using Pearson correlation coefficient) between the three ratios and slice position (n=27 slices; CA1_ratio: r= 0.98, p<0.01; CA3_ratio: r=0.88, p<0.01; DG_ratio: r=0.97, p<0.01) indicating that these ratios are very good predictors of slice position in the longitudinal axis. Black lines are regression lines.
