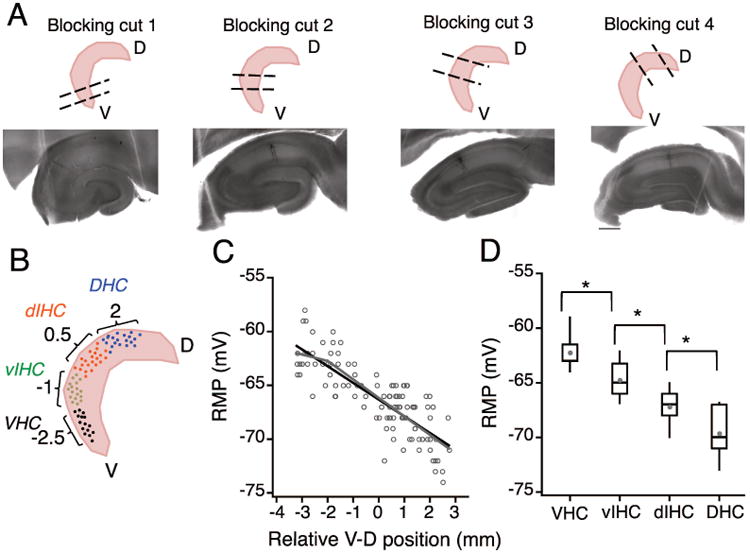
Figure 3. Using the coordinate system to predict longitudinal position of recorded slices.

A) Top row: Schematic representation of the four blocking angles used to obtain transverse sections from the ventral (blocking cut one), intermediate (blocking cuts two and three) and dorsal parts of the hippocampus (blocking cut four). Bottom row: Neurobiotin filled CA1 neurons in representative hippocampal sections obtained using the four different blocking angles. Note that the anatomical features of CA1, CA3 and DG are very different in the four example sections. B) Schematic to illustrate binning of recorded CA1 neurons into four groups based on the predicted longitudinal position (calculated using the linear regression model) C) Plot showing the resting membrane potential (RMP) of CA1 neurons against the relative ventral to dorsal (V-D) position of individual neurons. Note that the resting membrane potential (RMP) of CA1 pyramidal neurons was more depolarized at the ventral end and it decreased linearly along the longitudinal axis. There was a significant negative correlation (black regression line) between the RMP of CA1 neurons and the location of neurons along the longitudinal axis (r = -0.82, P<1e-29). Grey lines are the segmented regression fits of RMP values. D) The effect of V-D position on change in RMP of CA1 neurons was analyzed by binning the longitudinal axis into four groups (bin-size: 1.5 mm). Data are presented as whisker box plots displaying median, lower (25%) and upper (75%) quartiles, and whiskers representing 10% and 90% range of the data points. Grey filled circles represent the mean RMP value for every bin. RMP was most depolarized for neurons in VHC and decreased in all the subsequent bins. Resting membrane potential of neurons between all adjacent bins was significantly different (Kruskal-Wallis test, P=3.4e-17; Mann-Whitney U test for comparison among groups, **P<1e-5).
