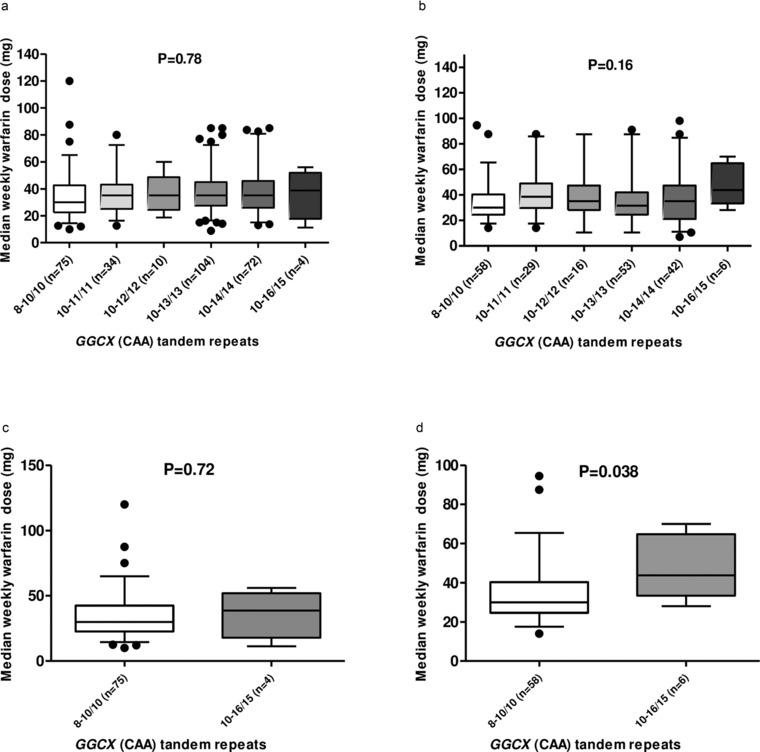
Figure 2.

Differences in weekly warfarin maintenance dose based on number of GGCX microsatellites. Comparison of median weekly warfarin dose by number of GGCX CAA tandem repeats in the European‐American cohort (a). The bottom and top of the box represent the 25th and 75th percentiles, respectively, and the band in the middle represents the median (50th percentile). The lower whisker represents 5th percentile of the data and the upper whisker represents 95th percentile of the data. Comparison of median weekly warfarin dose by number of GGCX CAA tandem repeats in the Egyptian cohort (b). The bottom and top of the box represent the 25th and 75th percentiles, respectively, and the band in the middle represents the median (50th percentile). The lower whisker represents 5th percentile of the data and the upper whisker represents 95th percentile of the data. Comparison of median weekly warfarin dose between the extreme CAA tandem repeat genotypes (8–10/10 vs. 10–16/15) in the European‐American cohort (c). The bottom and top of the box represent the 25th and 75th percentiles, respectively, and the band in the middle represents the median (50th percentile). The lower whisker represents 5th percentile of the data and the upper whisker represents 95th percentile of the data. Comparison of median weekly warfarin dose between the extreme CAA tandem repeat genotypes (8–10/10 vs. 10–16/15) in the Egyptian cohort (d). The bottom and top of the box represent the 25th and 75th percentiles, respectively, and the band in the middle represents the median (50th percentile). The lower whisker represents 5th percentile of the data and the upper whisker represents 95th percentile of the data.
