
Figure 1.
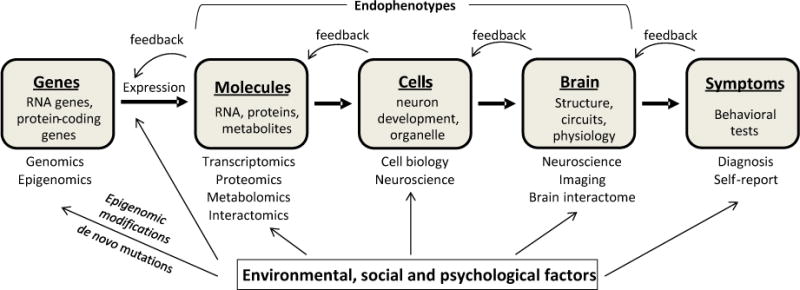
A simplified flow chart for psychiatric disorders: from genes to symptoms.
In this flow chart, results from one level (gray box) can exert feedback regulation at several levels upstream although only one level immediately upstream is shown for simplicity. Environmental impacts on each level are indicated. The studies for understanding each level and consequently the corresponding data types are listed below each level.