
Fig. 3.
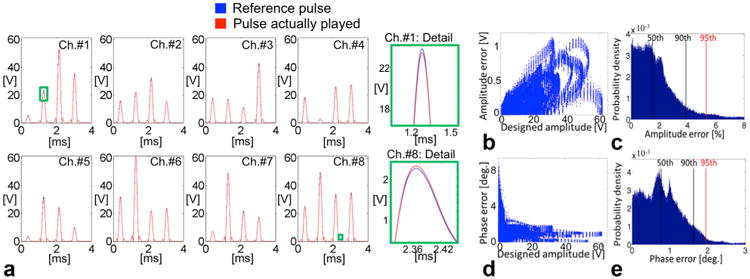
a: Four-spoke pulse played on eight Tx channels (reference pulse is in blue, the pulse actually played in red). A zoom-in detail of channels 1 and 8 is displayed to better visualize the differences. b: Difference between the desired and played RF amplitude as a function of the desired RF amplitude (linear correlation coefficient equal to 0.75). c: Histogram of the RF amplitude errors (SD = 2%). d: Difference between the desired and played RF phase as a function of the desired RF amplitude. e: Histogram of the RF phase errors (SD = 0.7°). In c and e, the 50th, 90th, and 95th percentiles are indicated with vertical lines.