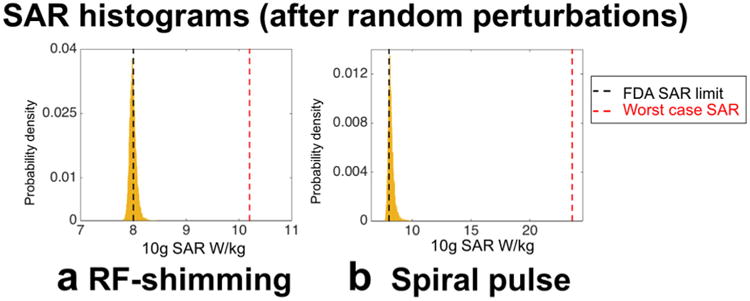
Fig. 5.

a: Distribution of the maximum local SAR of 10,000 random perturbations of an RF-shimming slice-selective excitation of 45° in the body (duty-cycle = 10%). b: Maximum local SAR distribution of 10,000 perturbed versions of a spiral pulse excitation of the liver for a flip angle of 20° (duty-cycle = 20%). Both pulses were originally designed to produce a maximum peak local SAR of 8 W/kg. Random perturbations of the original pulses were generated from the RF amplitude and phase error distributions of Figure 3 for the RF-shimming and Figure 4 for the spiral pulse. In both scenarios, worst-case SAR is far from the SAR values obtained in the VOPs for the perturbed pulses. However, errors as measured in the pTx system produce pulses exceeding SAR limits.
