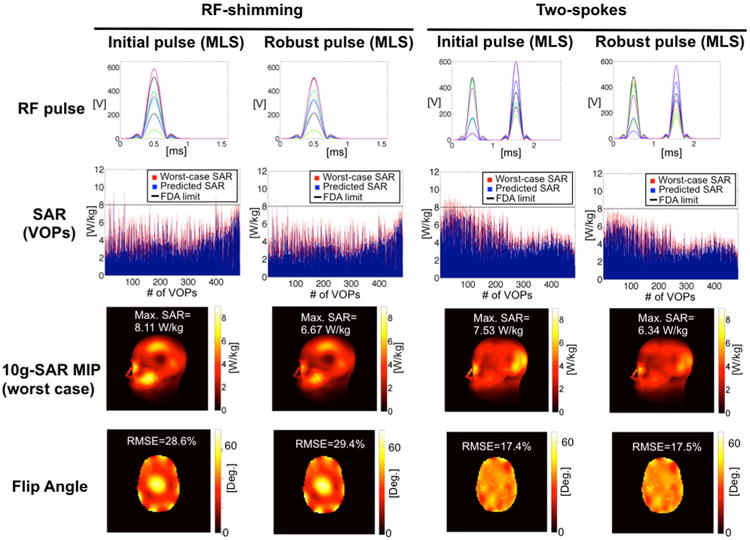
Fig. 7.

Evaluation of the proposed method for MLS spokes pulse design for head simulations in a 7T scanner. The worst-case SAR was calculated for a maximum deviation of 5% for the amplitude and 2.5° in the phase. The first row shows the original pulses as well as those modified to be robust in the presence of transmit errors. The second row shows the SAR distribution across VOPs of the original pulse (in blue) and its worst-case SAR version (in red). Horizontal black lines indicate the FDA SAR limits. The third row shows MIPs of the worst-case SAR distribution of all pulses. In the last row, the produced flip angle maps are displayed. The proposed algorithm design pulses that never exceed the safety limits with a minimum difference in the flip-angle distribution. Notice the large errors in the flip-angle maps due to the high target flip-angle value (45°).
