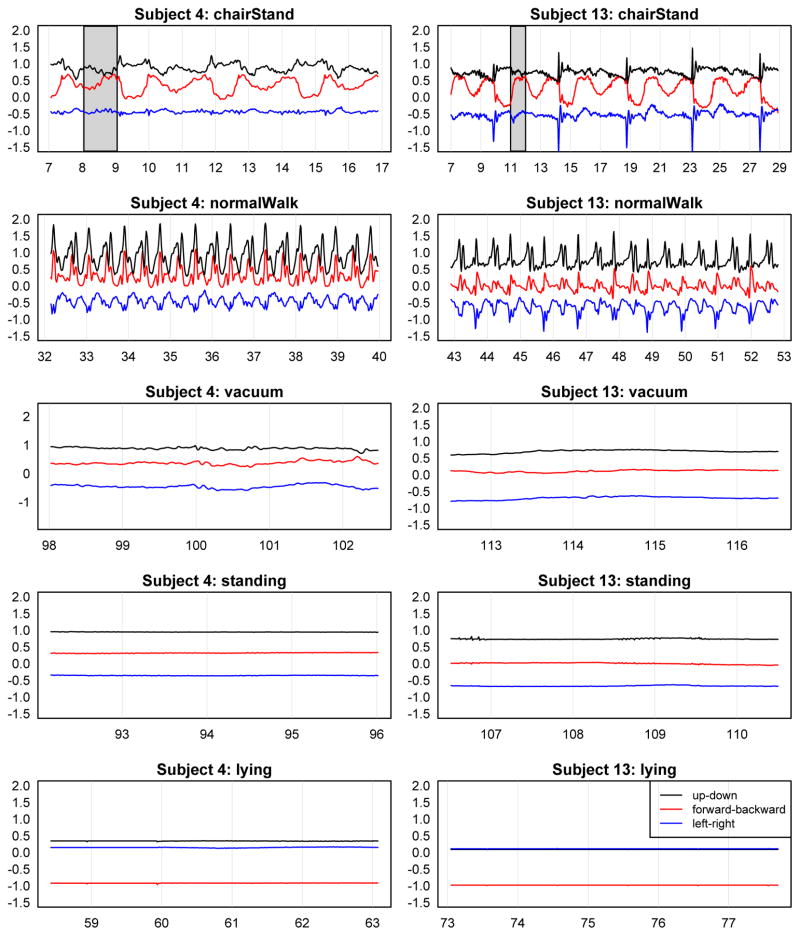
Figure 2.
Raw data of chairStand, normalWalk, vacuum, standing and lying from hip-worn accelerometers for two subjects. The x-axis denotes recording time in seconds; the y-axis denotes the signal expressed in g units. The legend in the bottom right plot applies to all plots. The shaded areas contain two 1s movelets. Note that orientation and placement of the device may change in the reference system designed around Earth’s gravity. This figure appears in color in the electronic version of this article.

