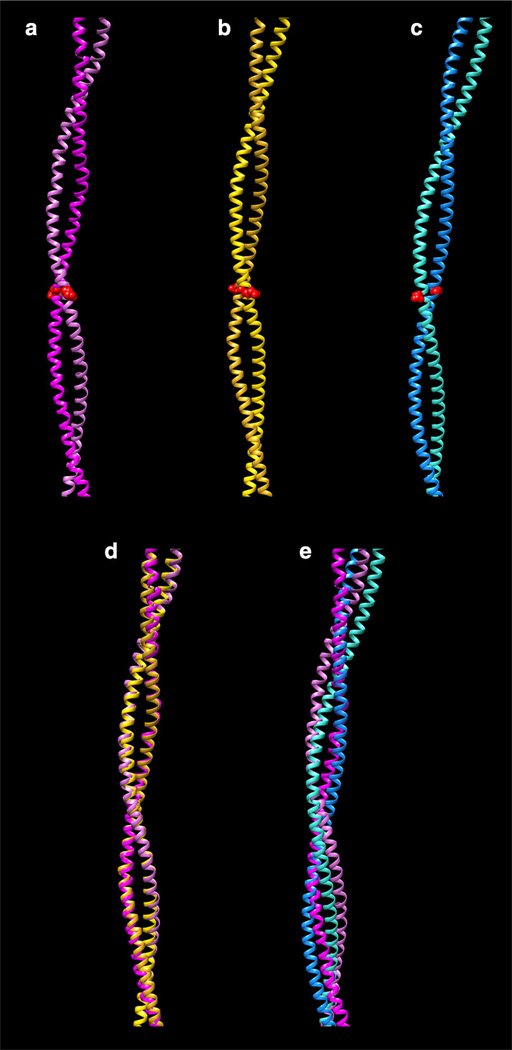
Fig. 2.
Fitting of different tropomyosin models to crystal structures. a Whitby and Phillips (2000) 7 Å resolution structure (PDB ID:1C1G). b Li et al. (2011) model. c von der Ecken et al. (2014) model (PDB ID:3J8A). Only residues in which the crystal structure remains super-helical are shown (residues 50–175). Note that the interacting-face is the same in (a) and (b), but differs from that in (c); for example, compare the orientation of the side-chain 104 (shown as red spheres). d Superposition of (a) and (b). e Superposition of (a) and (c). Note that the match in d is considerably better than in e. All structures are viewed with their concave side (i.e., the F-actin interacting-face) towards the right. Alignment of structures was performed using the MatchMaker tool of the program Chimera (Pettersen et al. 2004)

