Fig. 3.
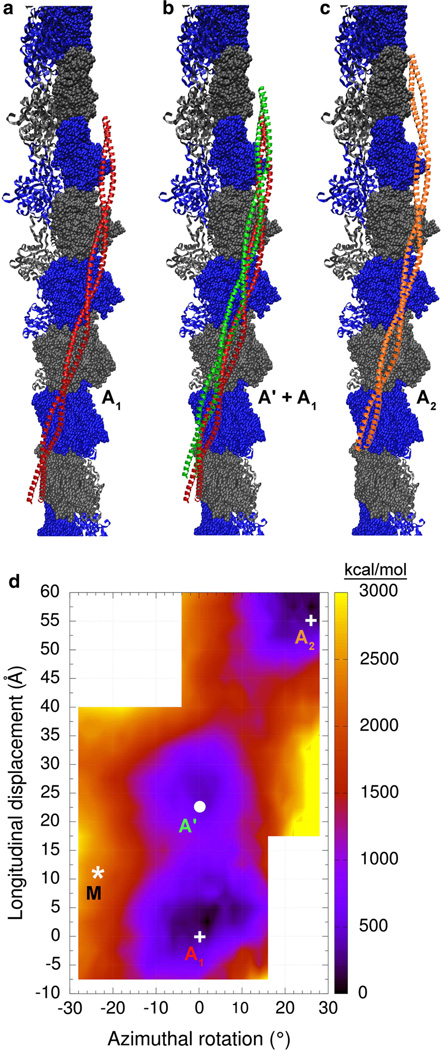
Coulombic interaction energy landscape of actin-tropomyosin. Shown are tropomyosin positions on F-actin (surface with alternating gray and blue colors). a the Li et al. (2011) tropomyosin model (red). b the Li et al. (2011) model in red and a tropomyosin model in green that corresponds to energy minimum A’ in d. c the Li et al. (2011) model (orange) shifted helically by one actin unit relative to its position in a. Note that the models shown here cover a large portion of the actin surface accessible to tropomyosin. d Each point in the energy landscape on this map gives the electrostatic energy of interaction between F-actin and one tropomyosin coiled-coil, which has been longitudinally and azimuthally repositioned while showing the same interacting-face to F-actin (see “Methods” section). The lower right hand and upper left hand corners of the graph were not sampled, since ridges on F-actin in those locations would result in severe steric clashes with the tropomyosin cable. Positions at the energy minima of the landscape are labeled A1, A’ and A2 (and with white circles and crosses) and correspond to the structures shown in a–c, respectively. The asterisk marked M indicates the position of the M-state model of Behrmann et al. (2012) for comparison. The energies [in kcal/mol] are given relative to the minimum energy position

