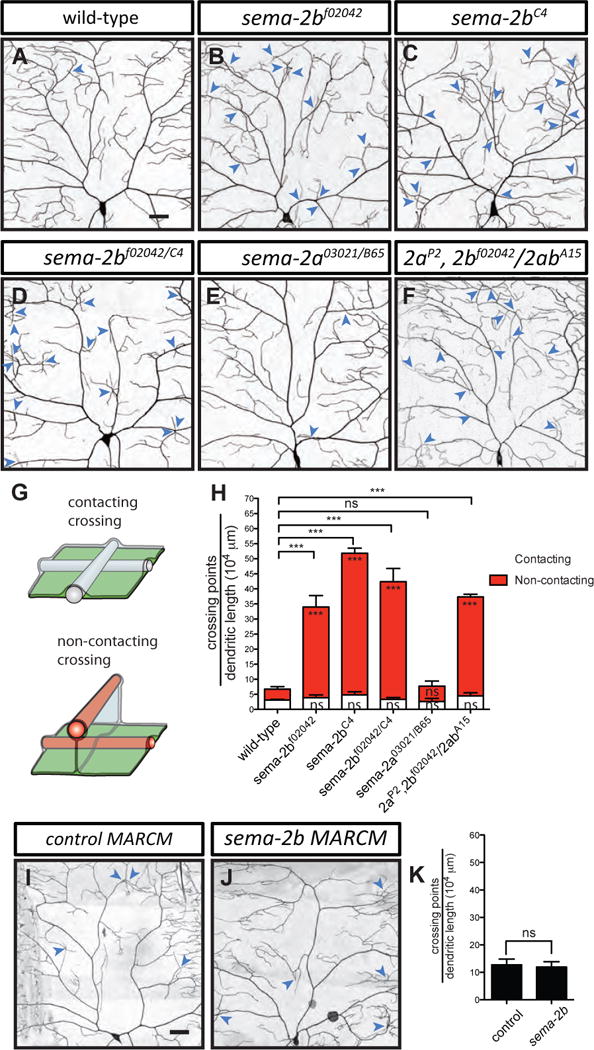
Figure 1. Sema-2b, but not Sema-2a loss of function leads to an increase in dendritic self-crossings.

(A–F) Dendritic patterns of wild-type (A), sema-2bf02042 (B), sema-2bC4 (C), sema-2bf02042/C4 (D), sema-2a03021/B65 (E), and sema-2aP2, 2bf02042/2abA15 (F) class IV da neurons. Dendritic crossings are indicated by blue arrowheads. Scale bars represent 30 μm. Wild-type animals are w1118 carrying one copy of ppk-CD4-tdTomato.
(G) Schematic of a contacting crossing (top) and a non-contacting crossing (bottom). In the case of contacting crossings, both dendrites (white bars) are in the same X–Y plane. In the case of non-contacting crossings, one or both dendrites (red bars) detach from ECM (green sheet) and become enclosed by the basal surface of epidermal cells (grey sheet).
(H) Quantification of crossing points normalized to total dendritic length in wild-type (n=6), sema-2bf02042 (n=4), sema-2bC4 (n=4), sema-2bf02042/C4 (n=7), sema-2a03021/B65 (n=4), and sema-2aP2, 2bf02042/2abA15 (n=4) mutant neurons. White bars represent the quantifications of contacting crossings and red bars represent the quantification of non-contacting crossings. Data are plotted as average ± SEM. ns, not significant, and ***p < 0.001 as assessed by one-way analysis of variance and Dunnett’s test. The comparisons of the total number of crossings are labeled on top of the bars. The comparisons of the contacting crossings and non-contacting crossings are labeled in the white bars and red bars, respectively.
(I–J) Dendritic patterns of control (I) and sema-2bC4 (J) class IV neurons generated with MARCM. Scale bars represent 30 μm.
(K) Quantification of total crossing points normalized to total dendritic length in control (n=3) and sema-2bC4 (n=3) class IV da neurons. Data are plotted as average ± SEM. ns, not significant as assessed by a Student’s t test.
