
Figure 3. Sema-2b is derived from epidermal cells and acts at short range to regulate dendrite adhesion.
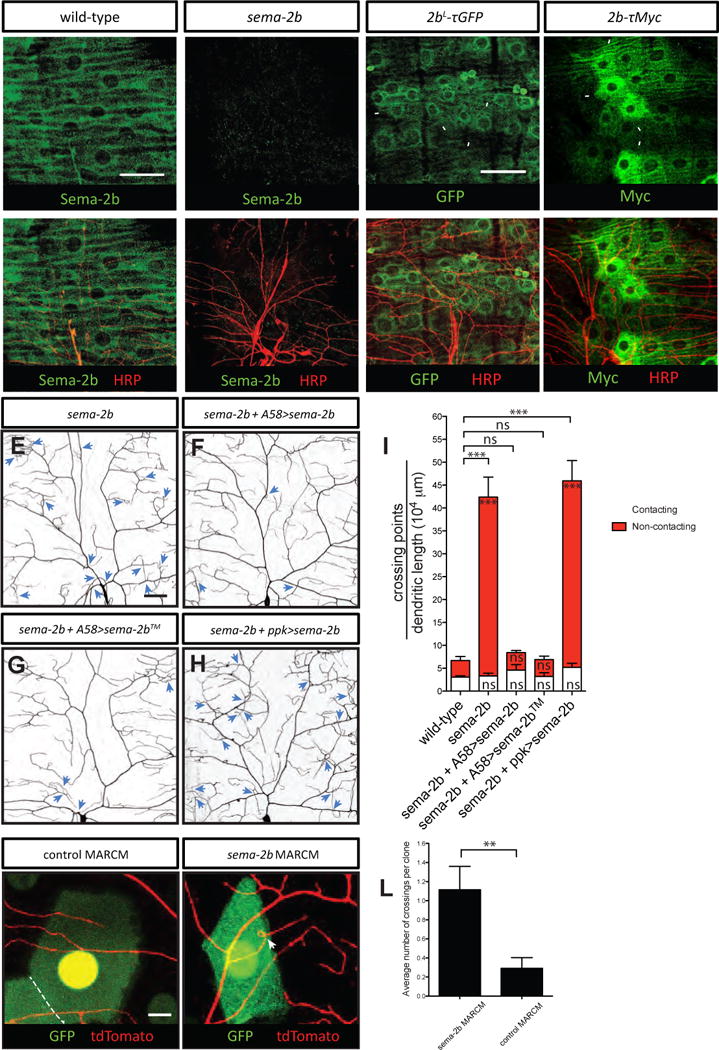
(A–A′) Anti-Sema-2b immunostaining of a w1118 wild-type third instar fillet reveals strong expression in epidermal cells. Anti-HRP immunoreactivity labels neurons in the peripheral nervous system.
(B–B′) No detectable Sema-2b staining in sema-2bC4 mutants. Scale bar represents 50 μm.
(C–C′) The 2bL-τGFP reporter labels epidermal cells that express Sema-2b. 2bL-τGFP animals were immunostained for τGFP and anti-HRP, which labels neurons in the body wall. Some GFP positive epidermal cells are indicated by white arrowheads.
(D–D′) The 2b-τMyc reporter labels a subset of Sema-2b-expressing epidermal cells. 2b-τMyc animals were immunostained for τMyc and anti-HRP, which labels neurons in the body wall. Some τMyc positive epidermal cells are indicated by white arrowheads. All the staining images are positioned with the anterior side on the left and dorsal side on the top.
(E–I) Dendritic patterns and quantifications of class IV da neurons in sema-2bf02042/C4 (E, n=7), sema-2b f02042/C4 mutant with epidermis-expressing full length Sema-2b (F, n=5), epidermis-expressing membrane tethered Sema-2b (G, n=5), and neuronal-expressing full length Sema-2b (H, n=6). Dendritic crossings are indicated by blue arrowheads. Scale bars represent 30 μm. Wild-type animals are w1118 carrying one copy of ppk-CD4-tdTomato. White bars represent the quantifications of contacting crossings and red bars represent the quantification of non-contacting crossings. Data are plotted as average ± SEM. ns, not significant and ***p<0.001 as assessed by one-way analysis of variance and Bonferroni test. The comparisons of the total number of crossings are labeled on top of the bars. The comparisons of the contacting crossings and non-contacting crossings are labeled in the white bars and red bars, respectively.
(J–K) Dendritic patterns of control (J) and sema-2bC4 (K) epidermal clones (labeled by GFP) generated with MARCM. Class IV da neurons are genetically labeled by one copy of ppk-CD4-td-Tomato. Scale bars represent 10 μm. The boundary between two adjacent epidermal cells is marked by a white dashed line.
(L) Quantification of total crossing points among dendrites that are covered by control (n=24) and sema-2bC4 (n=26) class IV da neurons. Data are plotted as average ± SEM. ns, not significant as assessed by a Student’s t test.