
Figure 4. Plexin B is the Sema-2b Receptor that regulates dendrite-ECM adhesion.
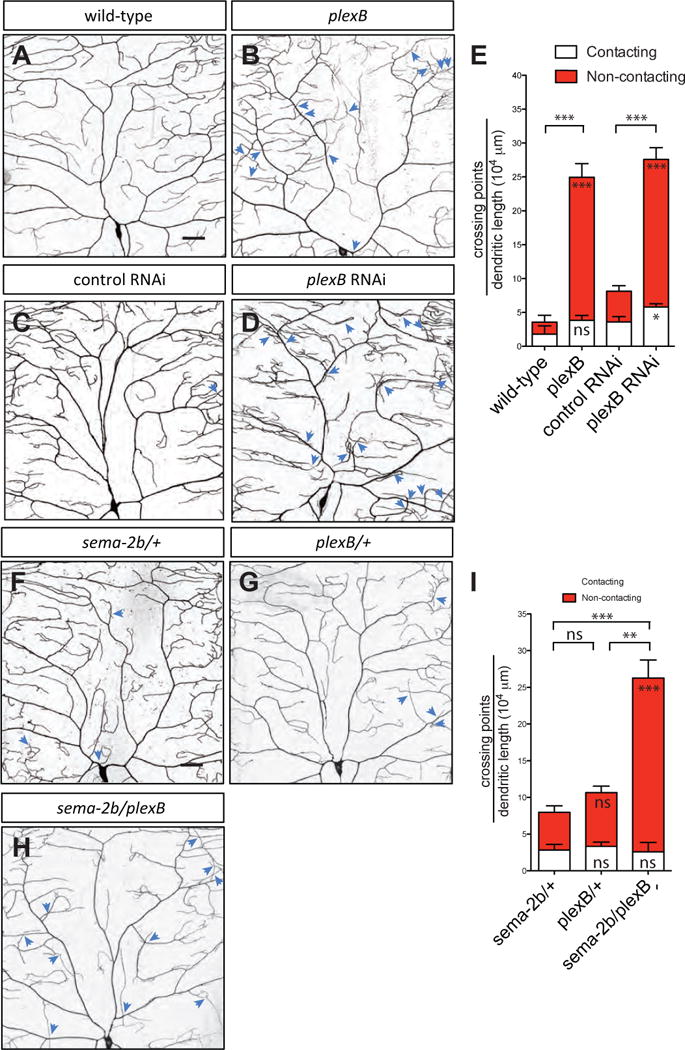
(A–D) Dendritic patterns of wild-type (A), plexBKG00878 (B), control RNAi (C) and plexB RNAi (D) class IV da neurons. Dendritic crossings are indicated by blue arrowheads. Scale bars represent 30 μm. Wild-type animals are w1118 carrying one copy of ppk-CD4-tdTomato.
(E) Quantification of total crossing points normalized to total dendritic length in wild-type (n=4), plexBKG00878 (n=6), RNAi control (n=6), and plexB RNAi (n=6) neurons. Data are plotted as average ± SEM. ns, not significant, *p<0.05, ***p < 0.001 as assessed by a Student’s t test. The comparisons of the total number of crossings are labeled on top of the bars. The comparisons of the contacting crossings and non-contacting crossings are labeled in the white bars and red bars, respectively.
(F–H) Dendritic patterns of sema-2bC4/+ (F), plexBKG00878/+ (G), and sema-2bC4/plexBKG00878 (H) class IV da neurons. Dendritic crossings are indicated by blue arrowheads. Scale bars represent 30 μm.
(I) Quantification of total crossing points normalized to total dendritic length in sema-2bC4/+ (F), plexBKG00878/+ (G), and sema-2bC4/plexBKG00878 (H) class IV da neurons. White bars represent the quantifications of contacting crossings and red bars represent the quantification of non-contacting crossings. Data are plotted as average ± SEM. ns, not significant and **p < 0.01, ***p<0.001 assessed by one-way analysis of variance and Bonferroni test for all pairs of columns. The comparisons of the total number of crossings in each genotype to sema-2bC4/+ are labeled on top of the bars. The comparisons of the contacting crossings and non-contacting crossings each genotype to sema-2bC4/+ are labeled in the white bars and red bars, respectively.