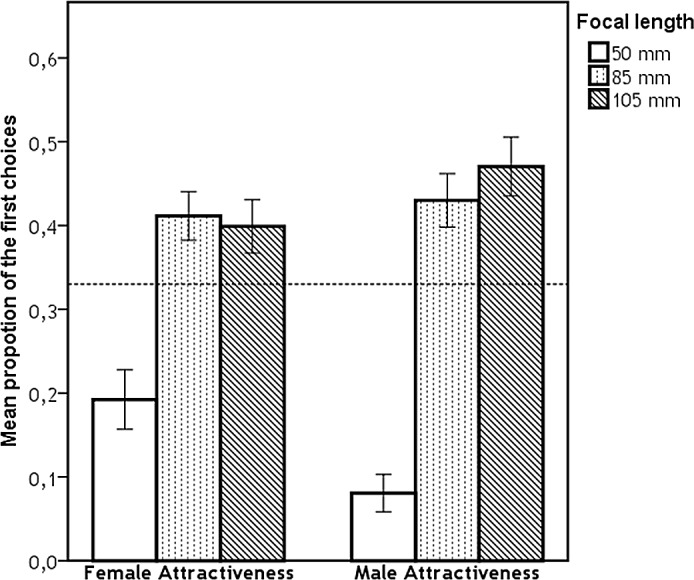
Fig 2. Proportion of first choices for each focal length with respect to their attractiveness.

Dashed line represents the proportion of ratings expected by chance (i.e., 0.333), error bars represent 95% CI.

Dashed line represents the proportion of ratings expected by chance (i.e., 0.333), error bars represent 95% CI.