
Fig 3. Proportion of first choices for each focal length with respect to their dominance.
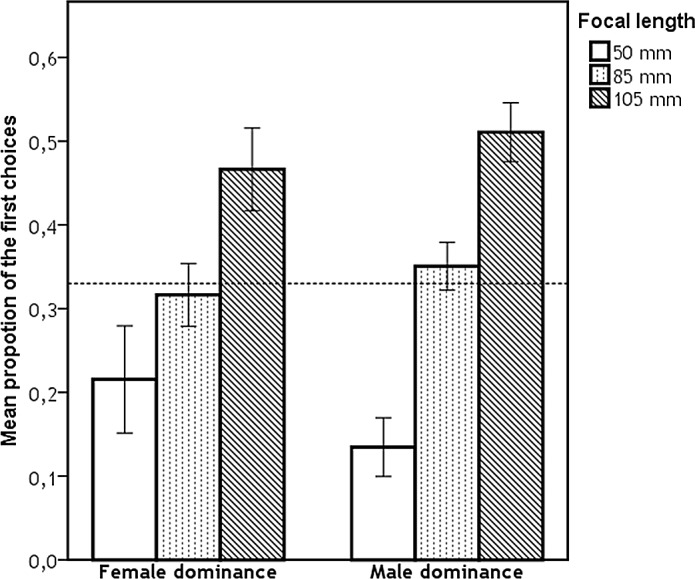
Dashed line represents the proportion of ratings expected by chance (i.e., 0.333), error bars represent 95% CI.
Official websites use .gov
A
.gov website belongs to an official
government organization in the United States.
Secure .gov websites use HTTPS
A lock (
) or https:// means you've safely
connected to the .gov website. Share sensitive
information only on official, secure websites.
Dashed line represents the proportion of ratings expected by chance (i.e., 0.333), error bars represent 95% CI.