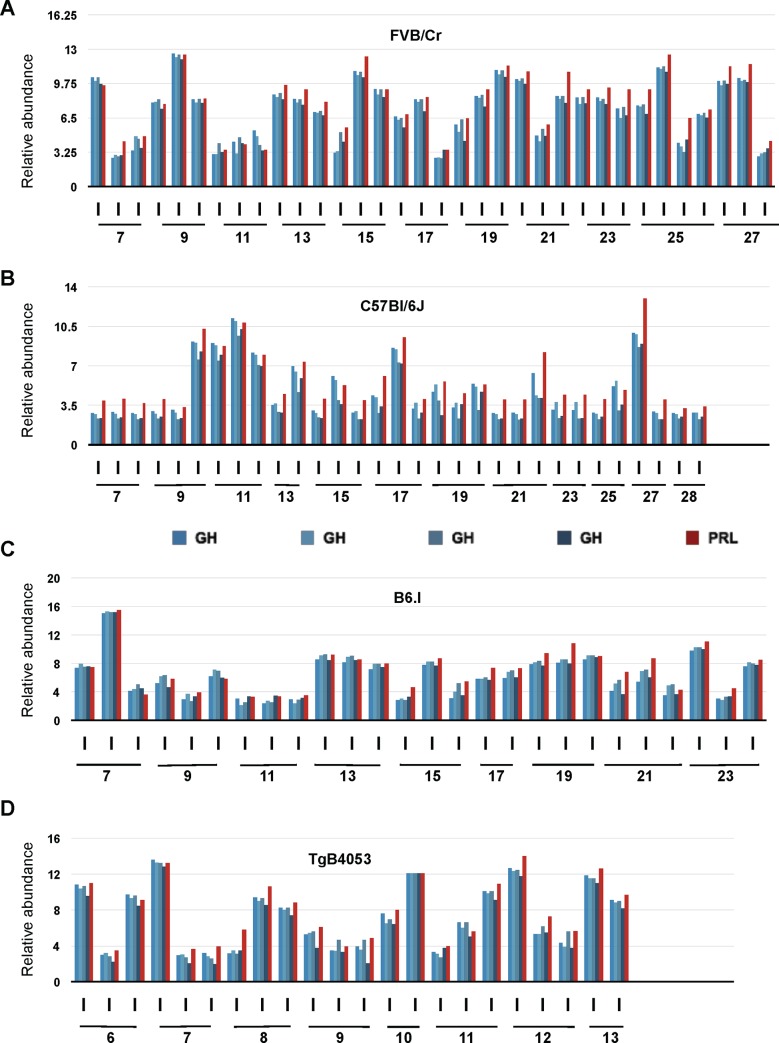
Fig 2. Microarray analysis of brain GH and PRL transcripts in 113 individual mice.
Expression profiles of GH (shades of blue, 4 different probe sets) and PRL (red, 1 probe set) in brain of individual mice of different background during aging is shown. Dynamic gene expression profiles of (A) mice of FVB/NCr background aged from 7 to 27 weeks (n = 34), (B) mice of C57Bl/6J background, aged from 7 to 28 weeks (n = 31), (C) mice of B6.I Prnpb background aged from 7 to 23 weeks (n = 26), (D) Data from TgPrnpa(4053) mice are shown aged from 6 to 13 weeks (n = 22).

