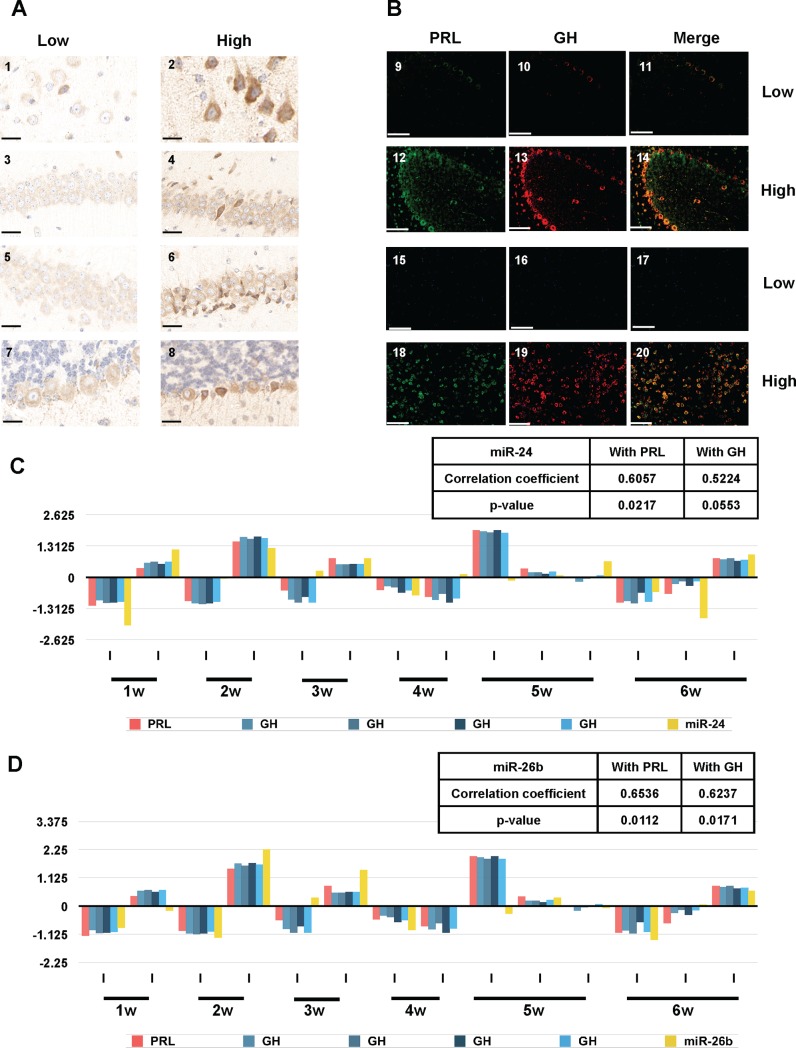
Fig 6. Immunohistochemical and miRNA analyses of mice with basal or elevated extra-pituitary GH/PRL expression.
(A) Representative histological sections of brains wild type mice stained with anti-GH antibodies. Panels 1, 3, 5, and 7 correspond to the brain of an animal which is a low expresser of GH/PRL by western blot while panels 2, 4, 6, and 8 correspond to the brain of an animal which is defined as a high expresser of GH/PRL by western blot. Different regions of the brain are shown: cortex (1, 2), hippocampus CA1 (3, 4), hippocampus CA3 (5, 6), and cerebellum (7, 8). Scale bars represent 25 μM. (B) Fluorescent double staining for PRL (green, panels 9, 12, 15, 18), GH (red, panels 10, 13, 16, 19) and merged expression (orange, panels 11, 14, 17, 20) is presented. Panels 9–11 and 15–17 correspond to the brain of an animal which is low expresser of GH/PRL by western blot while panels 12–14 and 18–20 correspond to the brain of an animal which is defined as a high expresser of GH/PRL by western blot. Different regions of the brain are shown: cerebellum (9 to 14) and amygdala (15 to 20). Scale bars represent 50 μM. (C) Correlation between brain GH/PRL transcripts and miR-24 in a cohort of healthy FVB TgMoPrnpa (4053) mice. (D) Correlation between brain GH/PRL transcripts and miR-26b in a cohort of healthy FVB TgMoPrnpa (4053) mice. The y-axes in panels C and D represent relative abundance (as per Figs 2 and 3) of the miRNAs.

