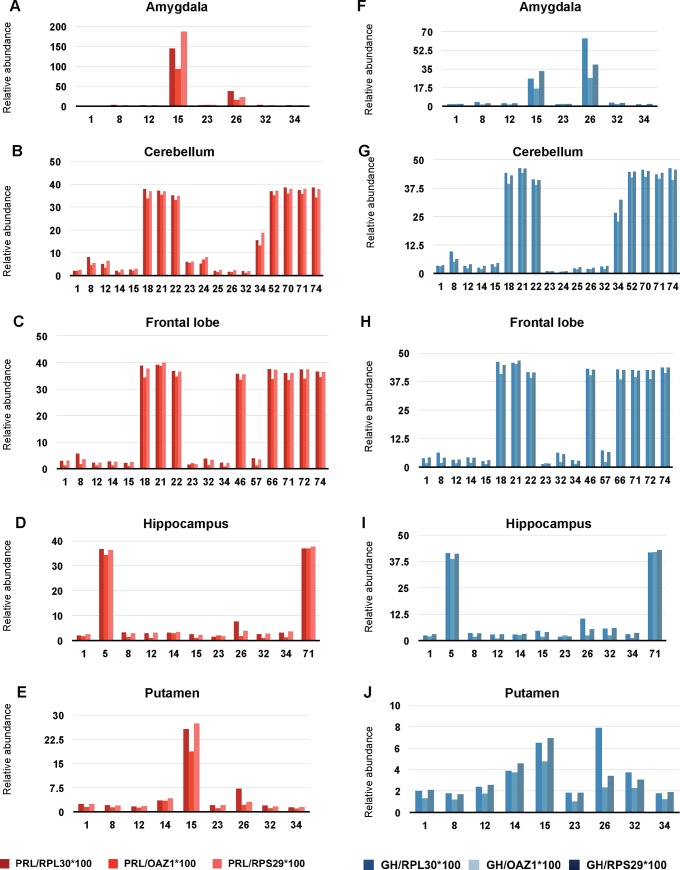
Fig 8. Microarray analysis of human brain regions reveals elevated extra-pituitary GH/PRL expression in a subset of subjects.
PRL and GH expression in different brain regions of healthy humans. Both PRL (A, B, C, D, E, different shades of red) and GH (F, G, H, I, J, different shades of blue) have been normalized to 3 different housekeeping genes (RPL30, OAZ1, and RPS29). Numbers on the abscissa represent individual cases. 1 to 22 are female and 23 to 77 are male. Samples are shown in increasing order of age. Different regions of the brain are shown: amygdala (A, F), cerebellum (B, G), frontal lobe (C, H), hippocampus (D, I) and putamen (E, J).

