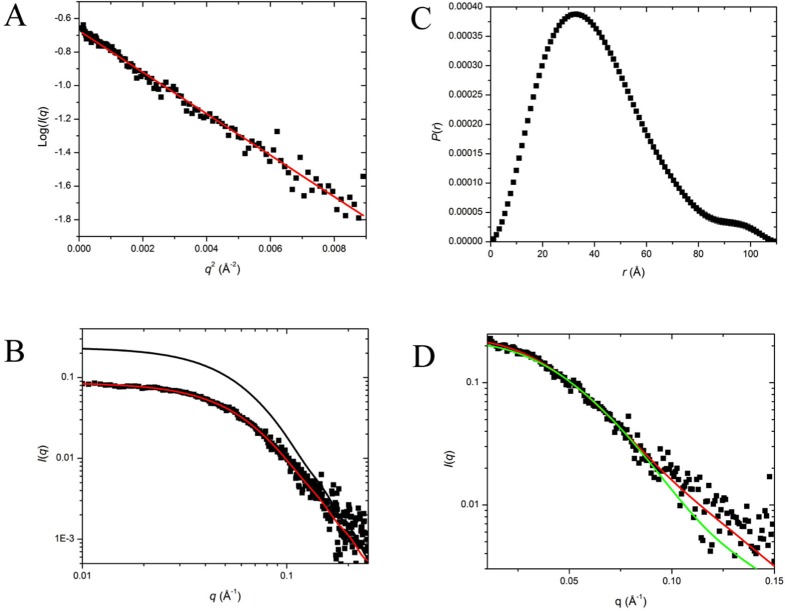
Appendix 2-figure 1. SAXS Data and Interpretation.
(A) Guinier plot of the desmeared I(q) versus q; (B) log:log plot of the measured (slit smeared) I(q) versus q with the P(r)- model I(q) (black line) and smeared P(r)-model I(q) (red line) fits; (C) P(r) versus r for the P(r) model in (B), dmax is 110 Å; (D) superposition of the desmeared I(q) versus q with that calculated from the crystal structure of the SorT/SorU2/SorT complex (red line) and the SorT dimer (green line).

