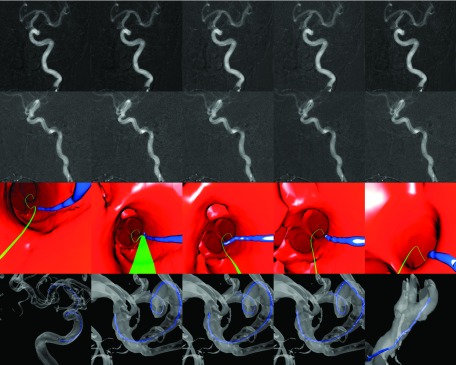
FIG. 7.
Clinical data set of a patient suffering a cerebral aneurysm. First two rows show the original fluoroscopic images of planes A and B, respectively. The third row shows the virtual endoscopic renderings of a guidewire near the MCA trifurcation. The green line represents the path to the predetermined target location, calculated from the vessel centerlines. The last row displays an overview of the guidewire position in a 3D rendering with a semitransparent vessel surface (see color online version).

