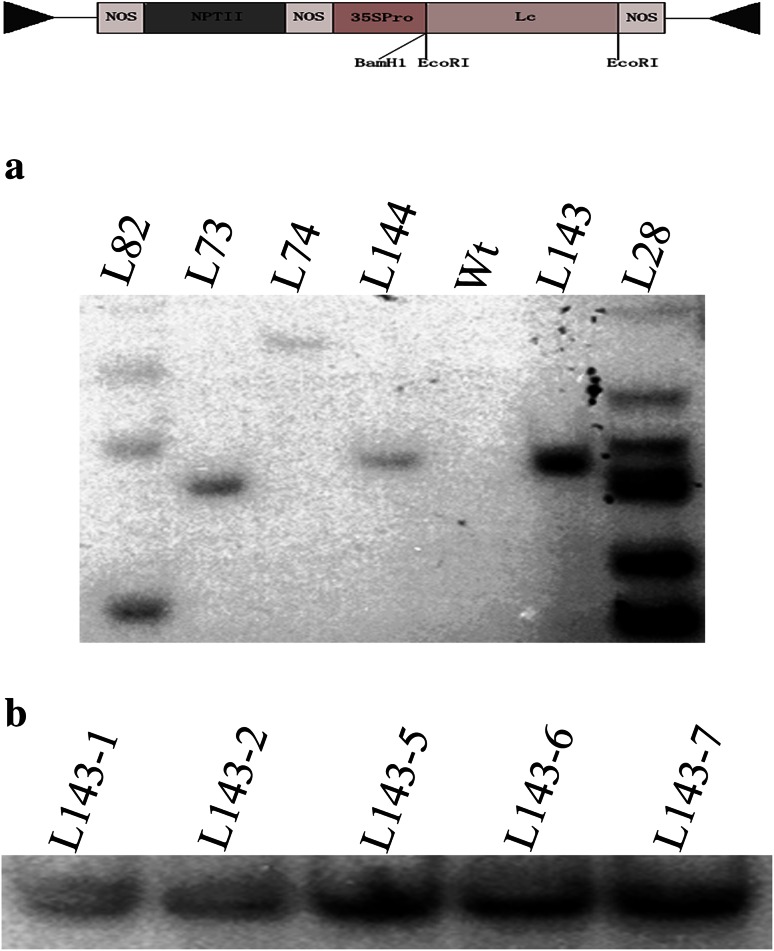
Fig. 1.
Southern blot analysis of the Lc-transgenic cotton plants. Genomic DNA from T0 transgenic (a) and T1 transgenic plants (b) was digested by BamHI and fractionated using gel electrophoresis. The blot was probed with a DIG-labeled Lc probe. a Lanes 1–4 and 6–7 represent six independent transgenic lines as indicated. Lane 5 is a nontransgenic control (Wt). b Lanes 1–5 represent five T1 siblings from L143 showing Lc hybridization bands

