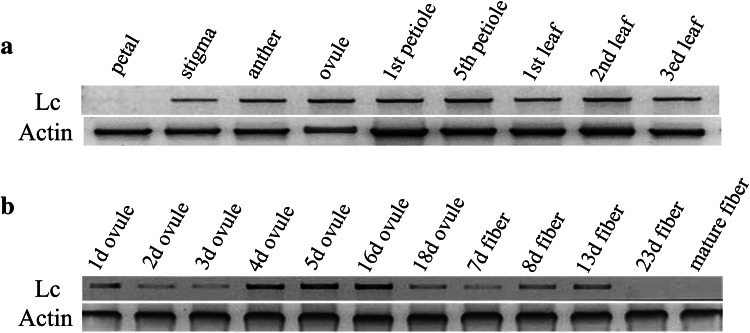
Fig. 2.
RT-PCR analysis of Lc expression patterns in transgenic cotton plants. a Upper panel Lc expression level in the indicated vegetative and reproductive tissues; lower panel Actin was used as internal control indicating no DNA contamination in the samples. b Lc expression in ovules and fibers at the indicated stages. Actin was used as an internal control

