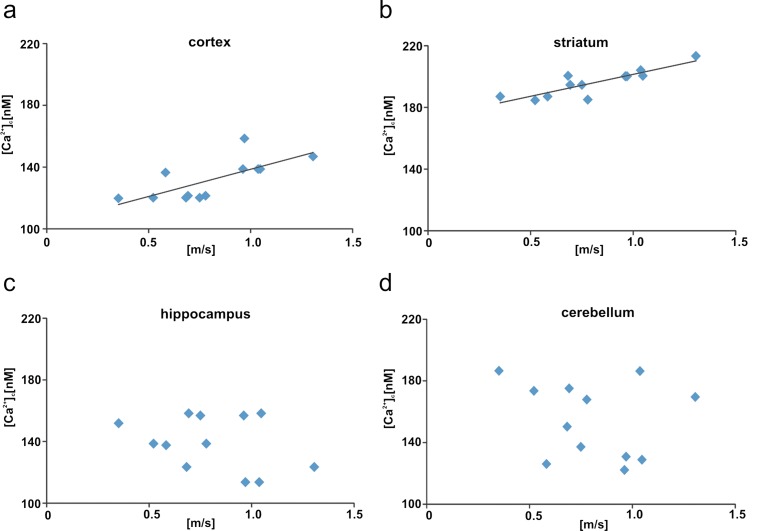
Fig. 4.
Correlations between resting [Ca2+]c and locomotor activity (average speed) in ketamine-injected rats. The line on the graphs represents the regressive line. Correlations assessed for selected brain areas: cortex (r = 0.705, P = 0.01, a), striatum (r = 0.864, P = 0.001, b), hippocampus (r = −0.33, P = 0.29, c), cerebellum (r = −0.21, P = 0.5, d). n = 12

