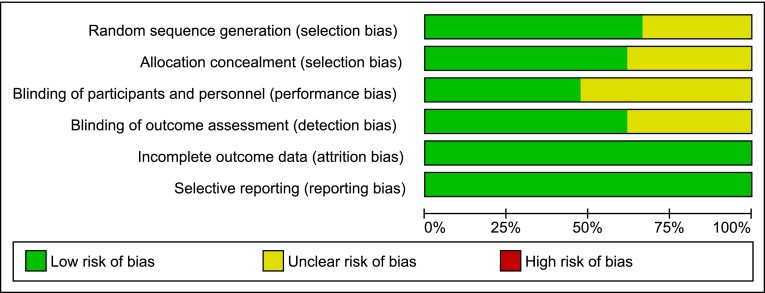
Fig. 4.
Risk of bias graph: judgements regarding risks of bias presented as percentages across all studies included in the systematic review (n = 21). This figure illustrates, for each considered bias domain, the proportion of studies falling in each category of risk (low risk of bias, high risk of bias, unclear risk of bias)

