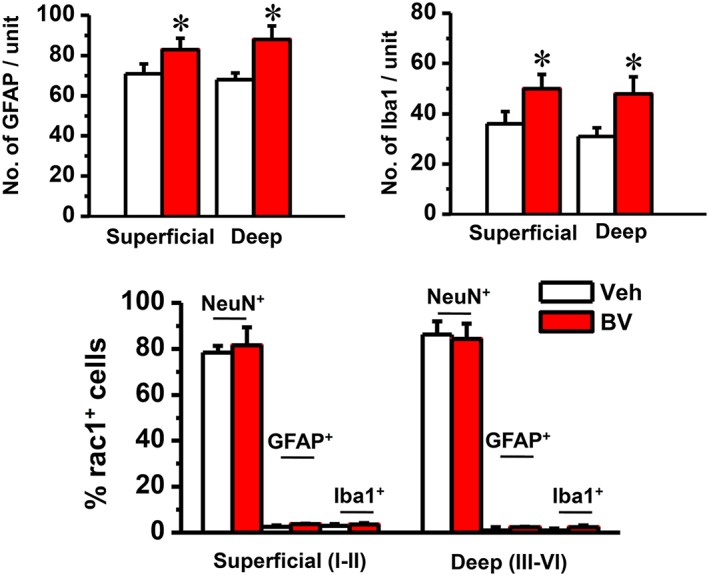
Figure 3.

Quantification of immunofluorescent labelling of GFAP‐positive and Iba1‐ positive profiles and double immunofluorescent labelling of Rac1 with NeuN‐positive, GFAP‐positive‐ and Iba1‐positive profiles. The upper panel shows the average numbers of GFAP‐labelled astrocytes and Iba1‐labelled microglia cells in the injection side of both superficial (layers I and II) and deep layers (layers III and VI) of spinal dorsal horn of rats that received s.c. injection of saline (Veh) or BV into a hind paw respectively. The lower panel shows that the percentage of NeuN‐labelled neurons, GFAP‐labelled astrocytes and Iba1‐labelled microglial cells in Rac1‐positive profiles was calculated in both superficial (layers I and II) and deep layers (layers III and VI) of the spinal dorsal horn respectively. Data are expressed as mean ± SEM. *P < 0.05, significantly different from Veh.
