
Figure 2.
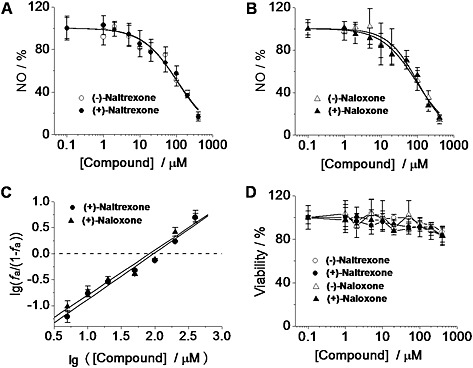
(±)‐Naltrexone and (±)‐naloxone inhibit LPS‐induced NO production in microglial BV‐2 cells. (A, B) BV‐2 cells were treated with LPS (200 ng·mL−1) and indicated concentrations of (±)‐naltrexone (A) or (±)‐naloxone (B) for 24 h. NO in the supernatant was detected by the 2,3‐diaminonaphthalene assay. The NO in the LPS (200 ng·mL−1) group was set as 100%. (C) Median‐effect plots of the inhibition by (+)‐naltrexone and (+)‐naloxone of LPS‐induced NO production . f a, fraction affected, that is, fraction of LPS‐induced NO being inhibited by (+)‐naltrexone/(+)‐naloxone. lg (x) means log10 (x). (D) BV‐2 cells were treated with various concentrations of (±)‐naltrexone or (±)‐naloxone for 24 h, and cell viability was monitored by Crystal violet staining. Data are presented as means ± SD (n = 6 in each group).