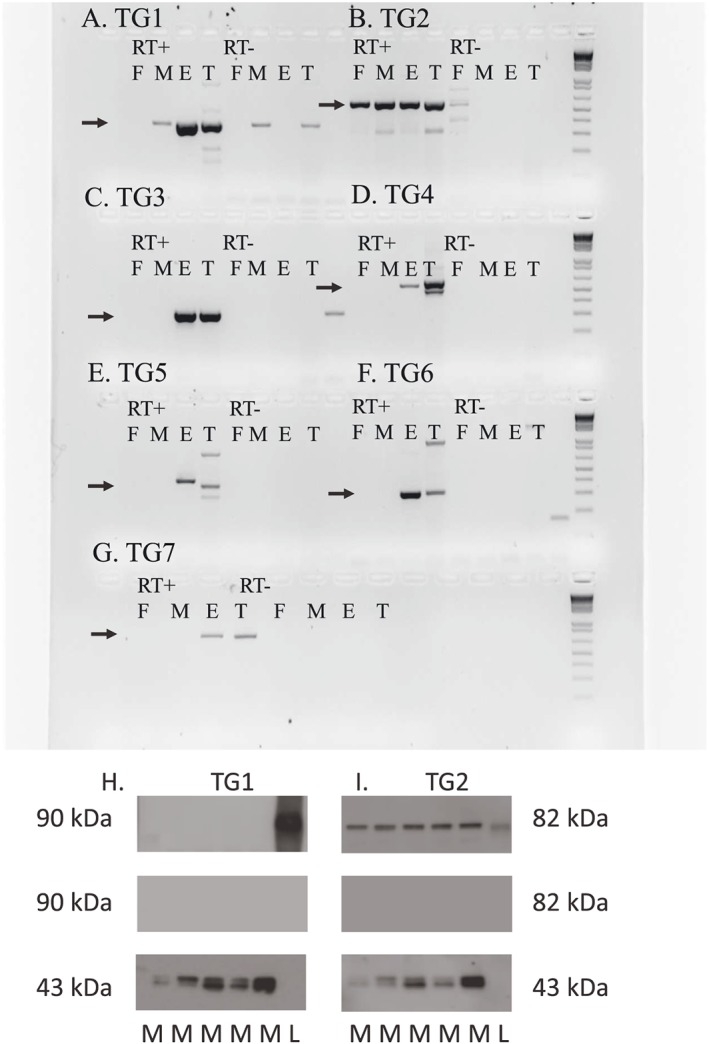
Figure 1.

Detection of transglutaminases (TG1–TG7) in rat mesenteric arteries by RT‐PCR and immunoblotting. (A–G) In all panels, lanes 1–4 are RT‐positive samples of rat femoral small artery (F), mesenteric small artery (M), ear (E) and testes (T), and lanes 5–8 are RT‐negative samples of the same tissues. The bands that were sequenced and confirmed as the right product are marked with an arrow. Primers can be seen in Supporting Information Table 1. (A) TG1, (B) TG2 (tissue transglutaminase), (C) TG3, (D) TG4, (E) TG5, (F) TG6 and (G) TG7. (H) Immunoblot of TG1 in rat mesenteric arteries located at 90 kDa (upper band). Controls with omission of primary antibody (middle band). Pan‐actin located at 43 kDa (lower band). Lanes 1–5 mesenteric arteries, lane 6 human TGase1 transfected 293T lysate (L). (I) Immunoblot of TG2 in rat mesenteric arteries located at 82 kDa (upper band). Controls with omission of primary antibody (middle band). Pan‐actin located at 43 kDa (lower band). In lane 6 human TG2 full length protein.
