
Figure 5.
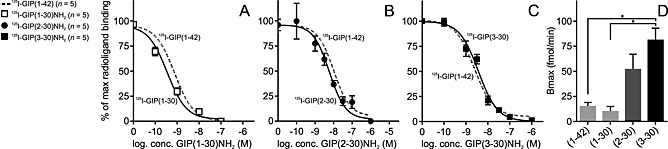
The homologous binding curves are equivalent to the heterologous binding studies with native 125I‐GIP(1–42) radioligand. (A–C) Transiently transfected COS‐7 cells with the GIP receptor were used in homolog competitive binding studies with 125I‐GIP(1–30)NH2, 125I‐GIP(2–30)NH2 and 125I‐GIP(3–30)NH2 and heterologous binding studies with 125I‐GIP(1–42), mean ± SEM. (D) Bmax values calculated from the homologous binding curves for GIP(1–42), GIP(1–30)NH2, GIP(2–30)NH2 and GIP(3–30)NH2. Data shown are means ± SEM, n = 5. Significance determined by multiple comparisons (one‐way ANOVA).