
Figure 8.
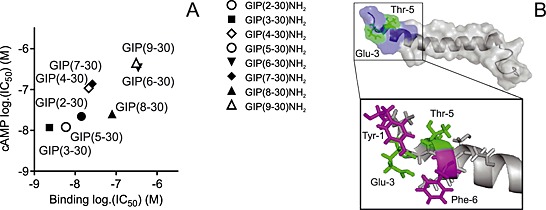
Correlation of affinity and antagonistic potency (A) and structure of the N‐terminus of GIP (B). (A) The correlation of calculated affinities (binding log.IC50) and antagonistic potencies (cAMP log.IC50) plotted for the eight GIP receptor antagonists (data from Table 1). (B) The published structure (Parthier et al., 2007) of the native GIP(1–42) peptide with amino acids 1–9 in blue, Glu3 and Thr5 in green and Tyr1 and Phe6 in pink.