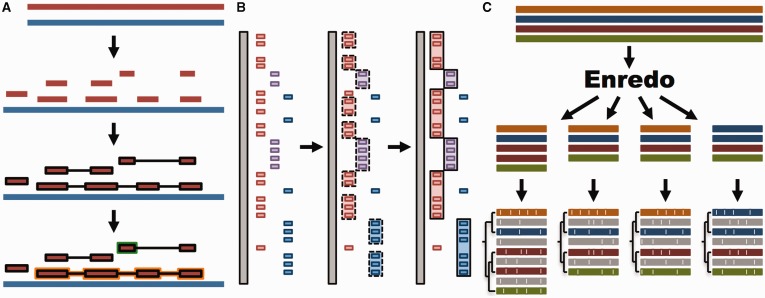
Figure 1.
Whole genome analysis pipeline. (A) Pairwise alignments. A reference genome (blue) is aligned to another genome (red) with LASTZ. The raw alignments that are in the same order and orientation are grouped in chains (highlighted in black). On each region of the reference genome, the best chain is selected to single out the set of nets. A top-level net (orange) can include a nested net (green) in regions it does not cover. (B) Large-scale syntenies. LASTZ-net alignments are sorted on a reference genome (grey). The red, magenta and blue boxes represent alignments to different chromosomes in the other genome. For simplicity, we assume that they are in the same order and orientation. Contiguous collinear alignments are joined in a first-pass, forming a nascent syntenic block. In the second pass, the nascent blocks are joined and extended further to build macro-synteny blocks. (C) EPO multiple alignments. The sequences of all genomes are fed into Enredo to build sets of collinear blocks. These are aligned with Pecan and Ortheus resulting in an alignment with inferred ancestral sequences (in grey).

