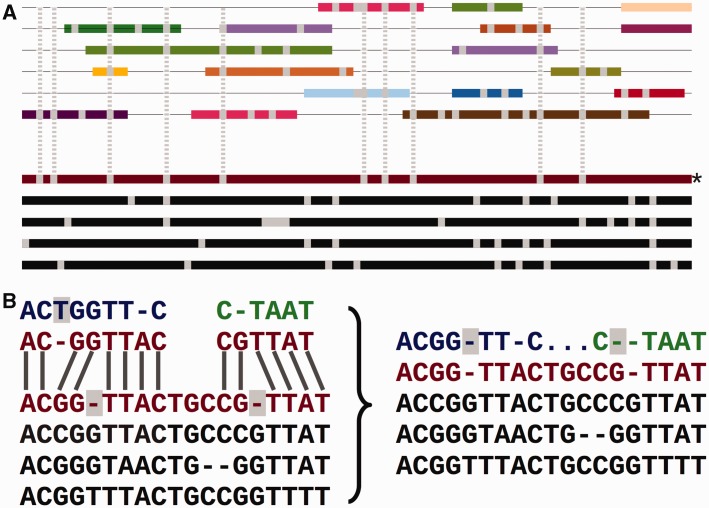
Figure 2.
Adding the secondary set of species to an EPO alignment. (A) Overview of the process. The lower part of the panel represents the initial consistency-based multiple alignment, where the red line represents the human sequence. The upper part shows a mosaic structure for each secondary species. The grey vertical lines show the gaps added to the secondary genomes to accommodate them in the multiple alignment and how they match the deletions in the human sequence. (B) Detailed view on the removal of species-specific insertions and addition of gaps in a secondary genome. The left-hand side of the panel shows a segment of the multiple alignment and the matching pairwise alignments to a secondary genome. The right-hand side of the panel shows the resulting alignment. The highlighted blue T on the left-hand side is removed from the final multiple alignment. The deletions in the human lineage (also highlighted) are added in the secondary genome.

