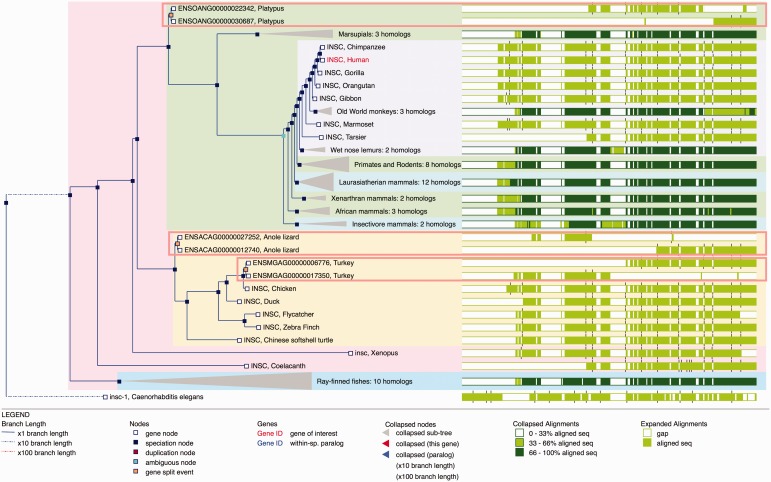
Figure 5.
Gene Tree with split genes. GeneTree for the INSC gene in Ensembl release 80. The blue nodes in the tree represent speciation events and the light brown nodes are gene split events. The background color is used to show the different species clades (sauropsids, primates, teleost fish, etc.). Some nodes are collapsed (grey triangles) and show a summary of that sub-tree. The right part of the figure shows an overview of the alignment where the white areas correspond to gaps in the protein alignments. The three light brown rectangles highlight the three gene-split events in this family. The alignment overview for these genes clearly shows how the genes have been split.

