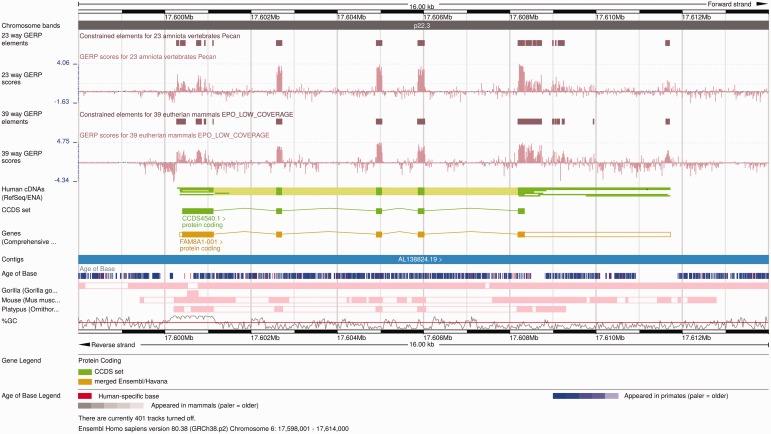
Figure 6.
Alignment and conservation tracks on the Location view. The image shows the 23-way amniote and 39-way eutherian conservation scores (pink wiggle tracks) and the corresponding constrained elements (brown blocks) on the FAM8A1 locus. The dark pink tracks at the bottom show the pairwise alignments of this region to the gorilla, the mouse and the platypus genomes. Each element represents an aligned block. These are connected in so-called nets that represent a series of alignment blocks in a congruent order and orientation. There is a secondary block in the gorilla pairwise alignment track, in the centre of the first FAM8A1 exon that represents a break in the continuity between human and gorilla in this region. Finally, the Age of Base track is displayed just below the contig line, and shows the how old each base of the genome is, ranging from human-specific mutations (in red) to primate-wide (shades of blue) and mammal-wide (shades of grey).

