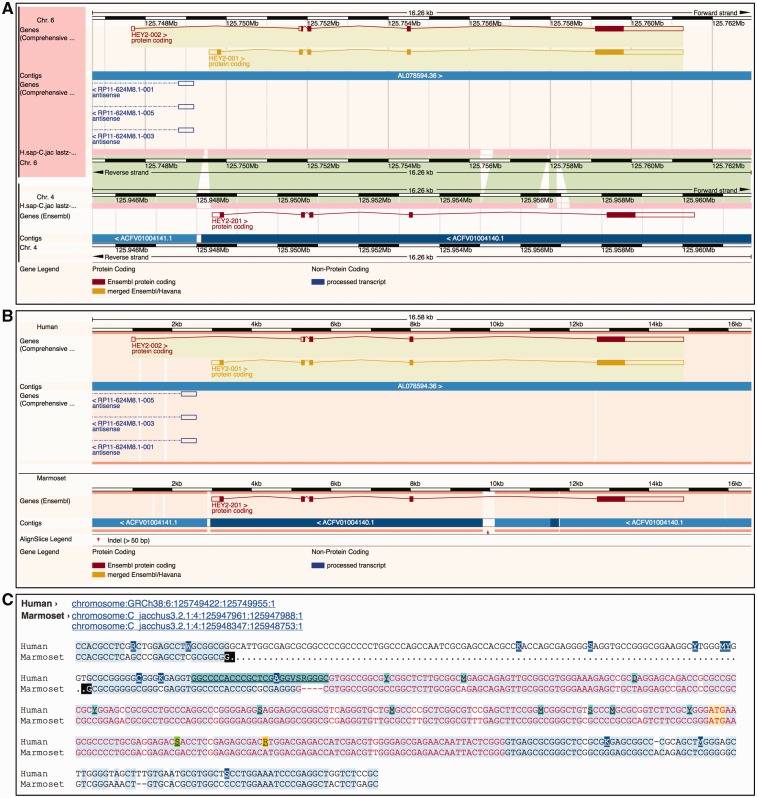
Figure 7.
Different alignment views in Ensembl. (A) Region Comparison view for the human and marmoset HEY2 genes. The top part of the panel shows the human locus while the bottom half represents the marmoset locus. As in the Location view (Figure 6), the dark pink tracks show the pairwise alignments. The green areas link each part of the alignment blocks, showing the connections between both genomes. (B) The graphic alignment view for the same region. The human and marmoset sequences are stretched to accommodate the alignment gaps. The vertical white segments in the background color show these gaps. The marmoset sequence is made of several fragments, as indicated by the alignment. (C) Base-pair detail of the alignment for the first exon. Exonic sequence is highlighted in red, start ATG codons in yellow and sequence variants are coded in different colors. At the top of the alignment, the user is presented with the list of loci in this alignment. The marmoset sequence is split in two different segments. The black marks highlight the edges of the aligned regions.

