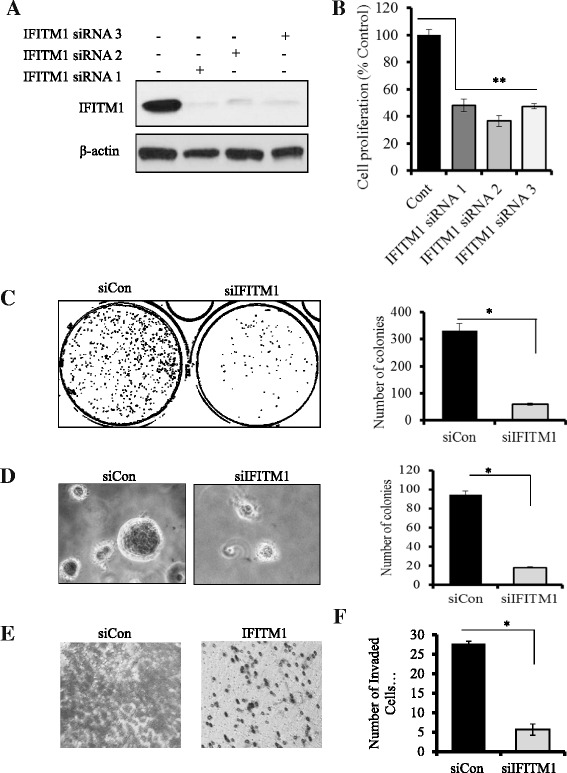
Fig. 2.

Effects of small interfering RNA (siRNA) knockdown of interferon-induced transmembrane protein 1 (IFITM1) on proliferation and tumorigenic potential of SUM149 cells. a Western blot analysis of SUM149 cells showing the protein levels of IFITM1. The IFITM1 gene was knocked down using three separate siRNAs (siRNA 1, siRNA2, and siRNA 3), and the control samples were transfected with a negative control siRNA (siCon) for 72 h. b Cell proliferation after 72 h of IFITM1 knockdown with three separate siRNAs. A 3-(4,5-dimethylthiazol-2-yl)-2,5-diphenyltetrazolium bromide assay was performed to assess cell proliferation. Bars represent mean ± standard deviation (SD). **P < 0.005 for siRNA knockdown compared with siCon. c 2-D colony formation showing the effects of silencing of IFITM1 in SUM149 cells on the formation of colonies in a 2-D surface. The images of the plates were captured using the ChemiDoc™ XRS System equipped with Image Lab™ software, then transformed and quantified by using ImageJ software. d Left panel: Anchorage-independent growth in soft agar showing the effect of IFITM1 knockdown on colony formation in SUM149 cells. The representative images were captured using a phase-contrast microscope equipped with an Olympus camera (original magnification, ×200). Right panel: The colonies were imaged using the ChemiDoc™ XRS System and quantified using ImageJ software. e Effect of IFITM1 knockdown on cell invasion and migration in SUM149 cells as assessed by Transwell Matrigel assay (Corning, Corning, NY, USA). The invaded cells were stained with crystal violet and imaged. f Quantitation of the number of invaded cells in SUM149 cells. The data presented are mean ± SD of three replicates. *P < 0.05
