
Fig. 6.
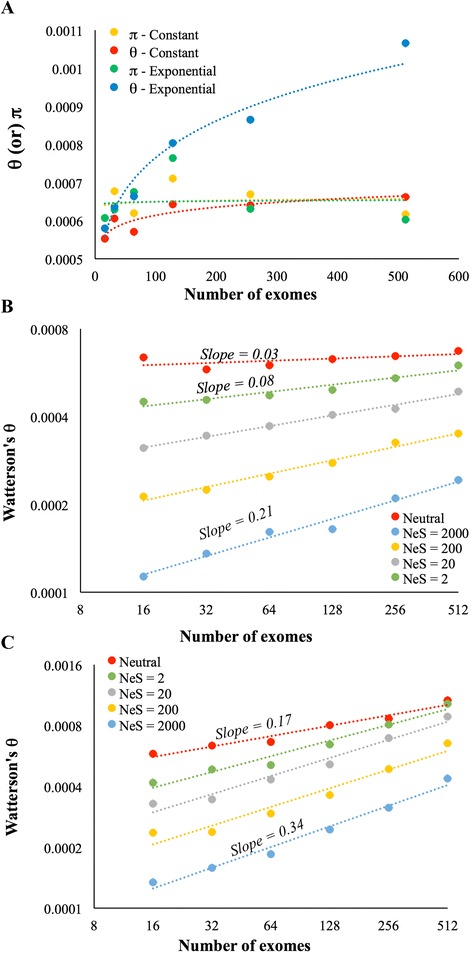
Results from the simulation study. a Estimation of θ and π using different number of genome sequences simulated under neutral evolution and constant as well as exponential growth models. Only the relationship between sample size and θ estimated for the exponential growth model was significant (P < 0.01) and other three were not (P > 0.06). b The estimates of θ obtained for the sequences simulated under neutral and under different levels of purifying selection using constant population growth model. The relationship between sample size and θ estimated for the sequences simulated under neutral evolution was not significant (P = 0.13). All other relationships were significant (P < 0.01). c θ estimates for the sequences simulated under neutral and under different levels of purifying selection using exponential population growth model. The figure shows the correlation between θ estimates and the number of simulated sequences used for the estimation. All relationships were significant at the 1 % level