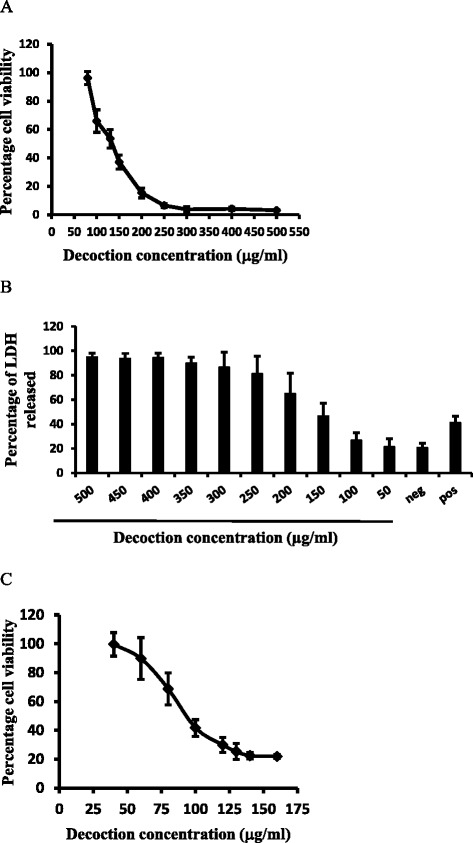
Fig. 1.

Cytotoxicity of HEp-2 cells induced by the decoction as determined by different cytotoxicity assays. a MTT assay was used to determine the percentage cell viability as described in the text. b The percentage LDH released after 24 h of treatment with the decoction. Hep-2 cells were treated with different concentrations of the decoction for a period of 24 h. Percentage LDH released was used to construct a dose response curve and the linear segment of this curve was used to determine EC50 value. ‘Neg’ and ‘Pos’ indicates untreated and 5.0 mM camptothecin-treated samples respectively. c Cytotoxicity of HEp-2 cells induced by the decoction as determined by SRB assay. Dose response curve for cell viability for decoction prepared with Adenanthera pavonina L. and Thespesia populnea L was used to determine the EC50 value using the linear segment of the curve. The results are presented as mean ± SD of at least three independent experiments
