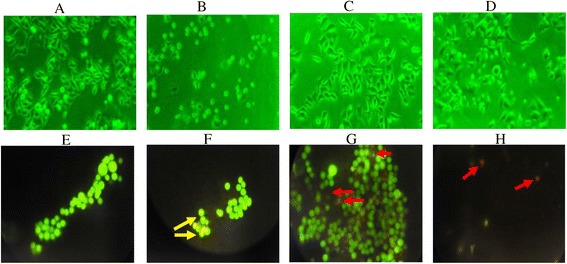
Fig. 2.

Images of HEp-2 cells on treatment with/without the decoction by light and fluorescence microscopy. (Top panel) Light micrographs (Phase contrast) of cultured HEp-2 cells after 24 h of incubation. a Untreated control cells b Cells incubated with camptothecin (5 mM; 25 μl) as positive control. c and d cells incubated with 50 and 100 μg/ml of the decoction respectively. (Bottom panel) Images of cells after treating with acridine orange-ethidium bromide staining. Untreated cells show a uniform green fluorescence e; cells treated with 50 μg/ml decoction appeared green with bright green nuclei indicating nuclear fragmentation and early apoptotic cells f; with 150 μg/ml of decoction g and camptothecin (5 mM; 25 μl) as the positive control h show late apoptotic cells by the orange red appearance due to the incorporation of both ethidium bromide and acridine orange. Yellow and red arrows indicate early and late apoptotic cells respectively. (Magnification 100X)
