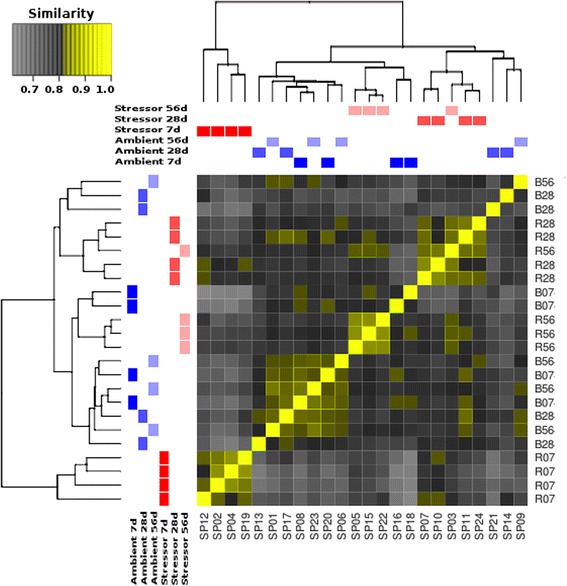
Fig. 1.

Transcriptome wide sample similarity matrix and cluster dendrogram: the sample similarity matrix represents the cumulative similarity of each individual at each time-point as a reflection of transcriptome wide gene expression. Transcriptome wide expression is represented by all gene products that demonstrated an FDR ≤ 0.05 during the differential gene expression analysis. Portions of the matrix shown in yellow demonstrate a high degree of similarity in the transcriptomic expression profiles between the two samples, with a value of 1 indicating the samples are identical; whereas those shown in grey demonstrate a lower degree of similarity, with a value of 0.65 demonstrating the most dissimilar expression profiles between two samples. As the samples are extracted from the same tissue and species, the degree of similarity in this case is a minimum of 0.65. The cluster dendrogram also groups samples based upon similar expression profiles, with those samples grouped most closely demonstrating more analogous transcriptomic expression responses
