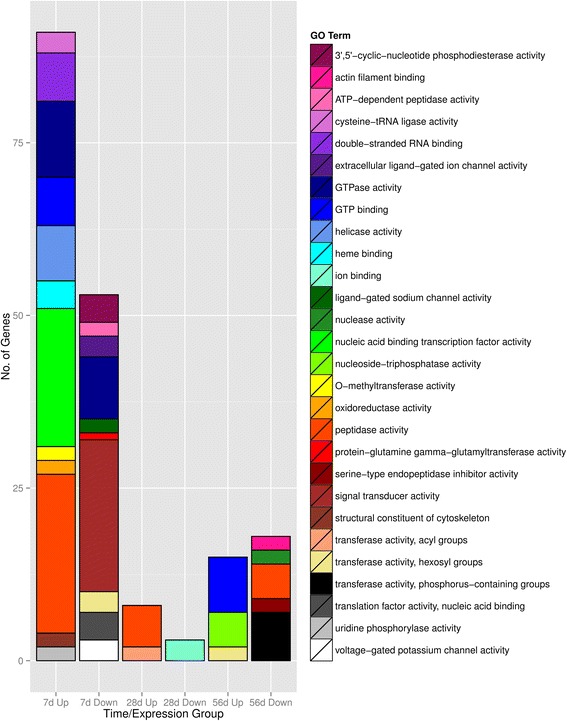
Fig. 3.

Over-representation analysis of gene ontology level 2 category molecular function: shown are gene ontology terms within the broad molecular function category (GO:0003674) that were significantly over-represented in the stressor treatments compared to the reference transcriptome as determined by a Fisher’s exact test (p < 0.01, categories containing only one gene are not included for readability). Subgroups of up- and down-regulated gene cohorts were created for each stressor time-point (7d, 28d and 56d) and compared to the GO term distribution of the reference transcriptome. The number in each category represents the total number of genes within that over-expressed GO term category (blank = 0)
