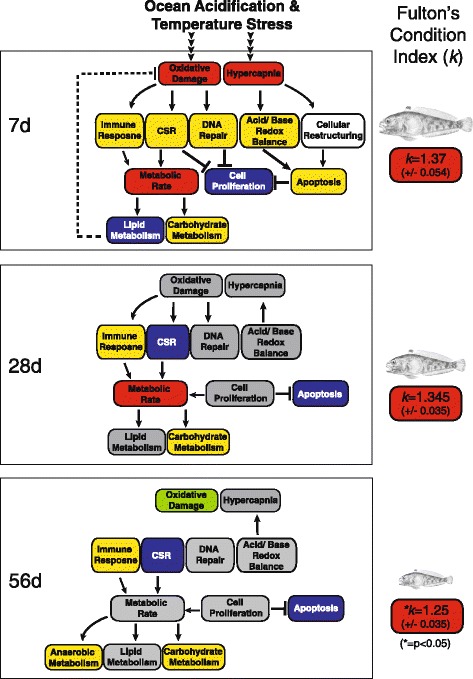
Fig. 8.

Schematic of molecular response integrated with physiological changes at the organismal level: Gene expression patterns identified in this study suggest a number of cellular pathways that were up-regulated (yellow boxes) or down-regulated (blue boxes) in fish acclimated to combined elevated temperature and pCO2 stressors over the course of 56 days. These changes likely underlie the physiological changes previously observed in T. bernacchii under these multi-stressor conditions (red boxes [30, 33, 34]). Although the expression of most genes returned to basal levels, a number of key genes remained up-regulated at the 56 day time-point suggesting T. bernacchii has not fully compensated. Ultimately, these stressors may impact the fish condition overall (as suggested by Fulton’s condition index [34]) and may have long-term population level impacts such as reduced growth and reproduction
