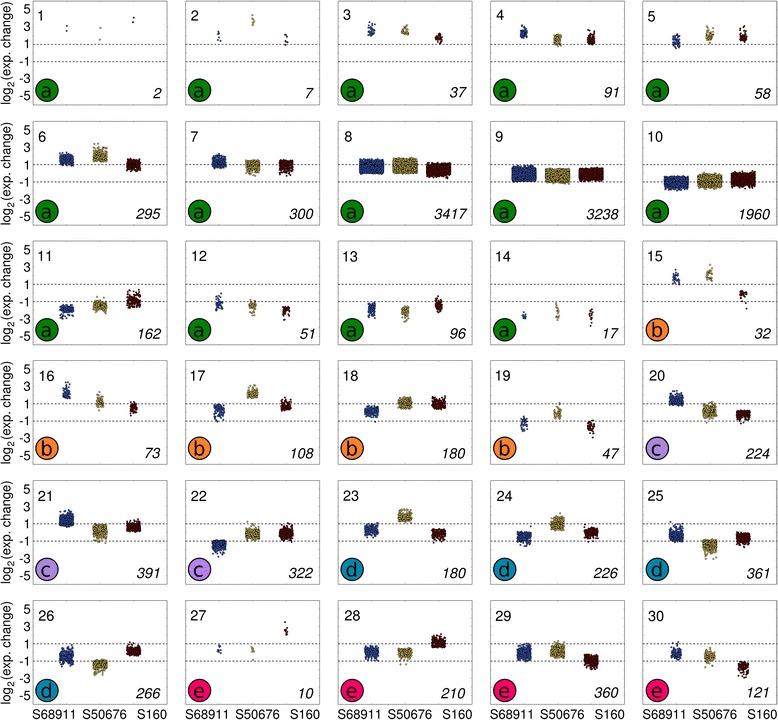
Fig. 4.

Clustering of genes according to magnitude of expression change upon cold treatment. Clusters were grouped manually into five sets (a – e) basing on the similarity of response in the three inbred lines studied. a. clusters 1-14, genes showing similar response in all three lines, from strongly induced to strongly repressed at low temperature, b. clusters 15-19, genes showing similar expression changes in two of the lines and no or small changes in the third line. c. clusters 20-22, genes specific to line S68911 (specific genes are defined as genes changing markedly - median magnitude of change in a cluster ≥2 – in a single line only), d. clusters 23-26, genes specific to line S50676. e. clusters 27-30, genes specific to line S160. Gene expression level was estimated in 3rd leaves of plants of three maize inbred lines treated with 14 °C/12 °C for 38 h (dark period + light period + dark period + 4 h of light period) in relation to the level in control plants grown at 24 °C/22 °C. The ratio of expression levels (ordinate) is shown as log2(cold/control). Inbred lines are indicated at the bottom of figure (abscissa). Each data point corresponds to a single gene; the points coalesce in densely populated regions. Cluster number is shown in left-hand top corner of each plot, cluster set in left-hand bottom corner, number of genes in a given cluster in right-hand bottom corner
