
Fig. 2.
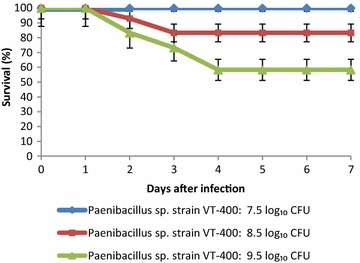
Seven-day survival (%) in mice challenged with 7.5 log10, 8.5 log10, and 9.5 log10 CFU of Paenibacillus sp. strain VT 400. Curves are representative of three independent experiments, with n = 8 in each treatment
Official websites use .gov
A
.gov website belongs to an official
government organization in the United States.
Secure .gov websites use HTTPS
A lock (
) or https:// means you've safely
connected to the .gov website. Share sensitive
information only on official, secure websites.
Seven-day survival (%) in mice challenged with 7.5 log10, 8.5 log10, and 9.5 log10 CFU of Paenibacillus sp. strain VT 400. Curves are representative of three independent experiments, with n = 8 in each treatment