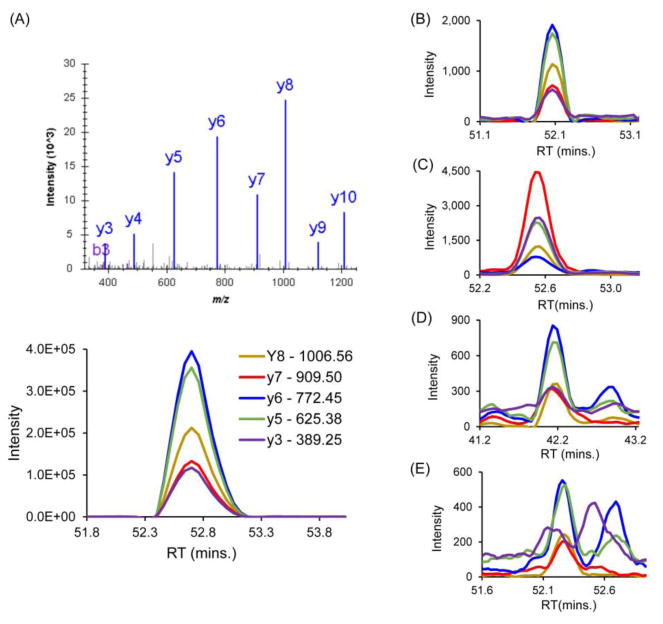
Figure 4. Representative MRM spectra showing the peak feature criteria to validate the expression of missing proteins.
(A) Reference MS/MS spectrum in DDA mode (upper) and MRM spectra of different transitions from the synthetic peptide. In comparison with the reference MRM peaks, sample peak (B) has similar peak features confirming validation. The relative intensities of the co-eluting fragment ions and the retention time are the same as in the reference peak. Sample peak (C) has different relative intensities of fragments compared to the reference peak, sample peak (D) widely varies in retention time relative to the reference peak, while sample peak (E) has low signal-to-noise ratio with fragment peaks not co-eluting. Sample peaks (C), (D), and (E) represent MRM results that does not match with the reference peptide spectrum, and therefore cannot be used for confirming the existence of the missing protein.

