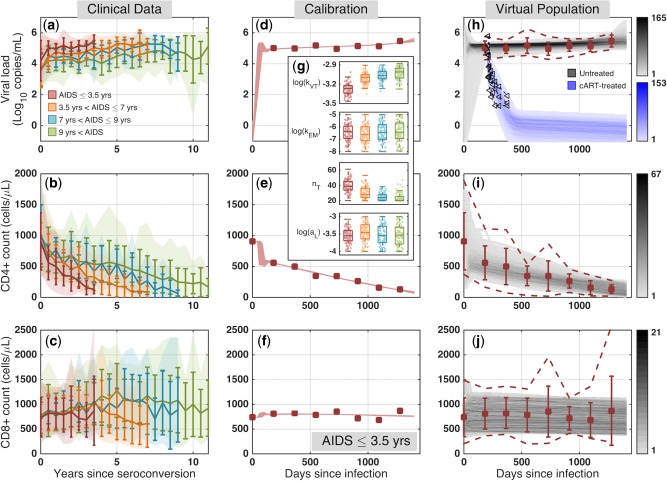
Figure 2.

Clinical data, model calibration, and generation of virtual population. (a–c) From the Multicenter AIDS Cohort Study (MACS) cohort, we collated viral load, CD4+ and CD8+ T cell counts from combination antiretroviral therapy (cART)‐naïve HIV‐infected individuals with known dates of HIV seroconversion and initial AIDS diagnosis; shaded regions: 5th and 95th percentiles of the aggregated data; dark colored lines: average and standard deviation. (d–f) We calibrated the model to match the average clinical data in rapid progressors; see Supplementary Figure S3 for all subpopulations; symbols: average clinical profiles; curves: 100 best fits. (g) The boxplots represent parameters values corresponding to the 100 best curves. See Supplementary Figure S4 for all parameters; (h–j) Virtual patient population captures the observed variability in clinical measurements of cART‐naïve rapid progressors and is validated against clinical data from decay of plasma viremia in another group of cART‐treated patients who received cART at 208 dpi30; symbols: average clinical profiles; dashed lines: 5th and 95th percentiles of the aggregated data; black symbols: clinical data for the viral load decay; gray regions: temporal histograms of cART‐naïve patients; blue region: cART‐treated virtual patient profiles.
