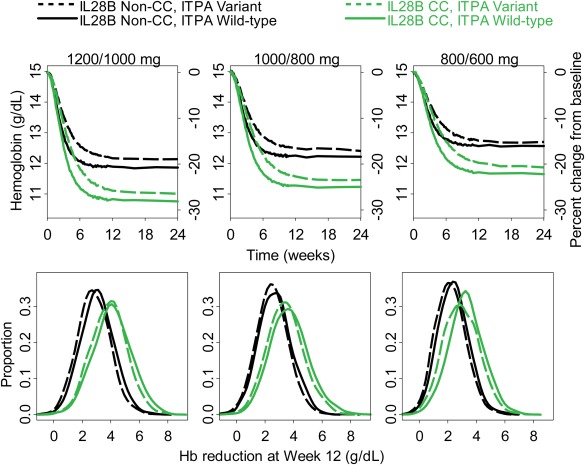
Figure 4.

Simulation of hemoglobin profiles (top), distribution of hemoglobin level reduction from baseline at week 12 (bottom), for standard 1,200/1,000 mg daily dosing (left) 1,000/800 mg (middle), and 800/600 mg (right). Solid black lines: IL28B Non‐CC, ITPA wild‐type. Dashed black lines: IL28B Non‐CC, ITPA variant. Solid green lines: IL28B CC, ITPA wild‐type. Dashed green lines: IL28B CC, ITPA variant.
