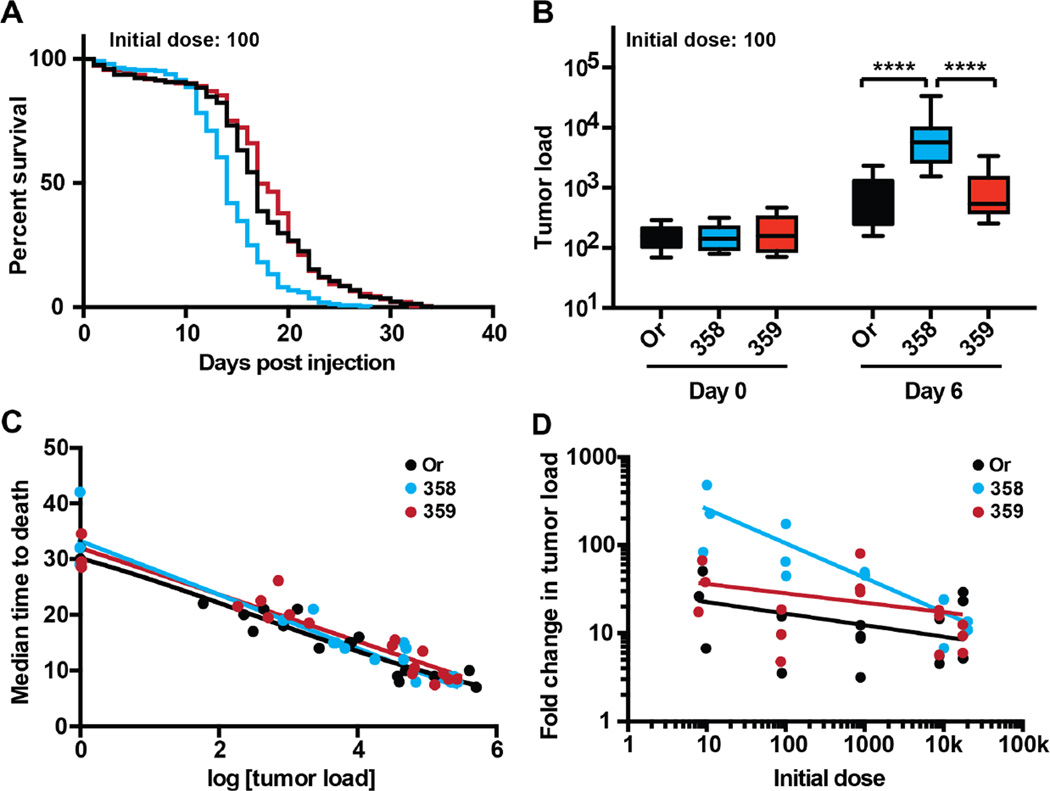
Figure 2. Genetic variation alters resistance to cancer.
Wild-type (Oregon-R) and natural variant adult male flies were injected with doses varying from 10–20,000 KRas hyperplastic cancer cells and were monitored for survival (disease progression) and cancer load (pathogen load). Wild-type (Oregon-R) is in black, RAL-358 is in blue, and RAL-359 is shown in red. A. A survival curve of adult flies injected with 100 cancer cells, comparing wild-type and natural variant flies. RAL-358 dies significantly faster than wild-type or RAL-359 (****, p<0.0001, Log-rank (Mantel-Cox) test) (n ≥ 180 flies per line). Whereas there is no significant difference between wild-type and RAL-359. B. A cancer growth plot showing the initial dose of 100 cells and the cancer burden of flies 6 days post injection. RAL-358 has a significantly higher cancer load than either wild-type or RAL-359 (****, p<0.0001, two-way ANOVA Tukey’s multiple comparisons test) (n ≥ 150 flies per dose per day). C. A cancer disease tolerance curve was prepared for each of the three fly lines (wild-type, RAL-358, and RAL-359) by plotting pairs of cancer load and survival data for 18 cancer load/MTD pairs for each line (n ≥ 110 flies per data point). These curves were each fit with a linear regression model (r2>0.94 for wild-type, r2>0.91 for RAL-358, and r2>0.91 for RAL-359). The slope of these lines is similar (−4.1 for wildtype, −4.8 for RAL-358, and −4.2 for RAL-359) and the 95% confidence intervals overlap. D. The ratio of cancer growth over six days PI. Wild-type is in black, RAL-358 is in blue, and RAL-359 is shown in red (n ≥ 150 flies per line per day in all of these experiments). The data for each of these lines were fit with a log-log non-linear regression, 0.12, 0.57, and 0.13 R2 for Or, RAL-358, and RAL-359 respectively. The slope of the log-log nonlinear regression is −0.13, −0.4, and −0.11 for Or, RAL-358, and RAL-359 respectively. The 95% confidence interval for the slope of RAL-358 remains negative while the 95% confidence interval for the slope of wild-type and RAL-359 ranges from negative to positive. In a non-linear log-log line regression F test, one curve does not fit all the data (p < 0.0001).

